

A nice gain on US Stock Markets today. A lot of the action actually happened overnight during futures, but we did pop on the US open. Now, US markets have just ranged at time of writing.
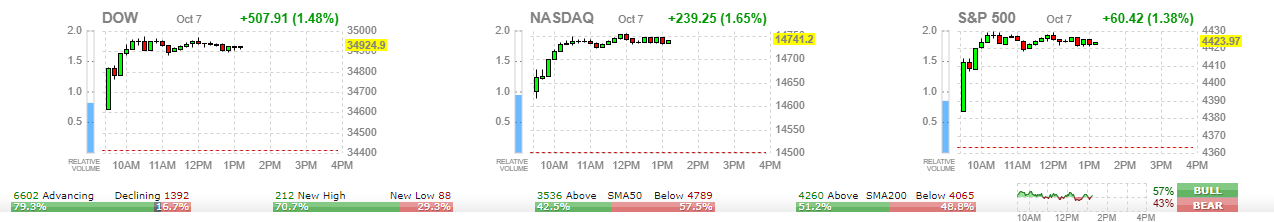
One argument for weaker Stock Markets from the bears seems to have been solved…at least until December. Law makers have agreed on a deal for a short term debt ceiling increase. The pact allows the debt limit to increase by $480 billion, a sum the Treasury Department says will let it pay bills until Dec. 3rd 2021.
Tomorrow is the big day with NFP data on Friday. I am watching that closely due to Powell saying the Fed committee wants to see an improvement on jobs data before deciding on a taper timeline. If the NFP data comes in as a blowout, the market will begin pricing in tapering sooner rather than later. Maybe even a taper timeline at this months Fed meeting, but more likely the next one. If you are one that believes these markets are propped up on cheap money and the Fed, then the probability of a taper would cause a taper tantrum. Or stock markets to fall. So yes, even with good economic data, stock markets could drop. Watch out for this tomorrow.
When we looked at the S&P 500, I spoke about the daily chart reaching our major support flip zone. This was the area I targeted on our market shorts detailed in this Market Moment a few weeks back.
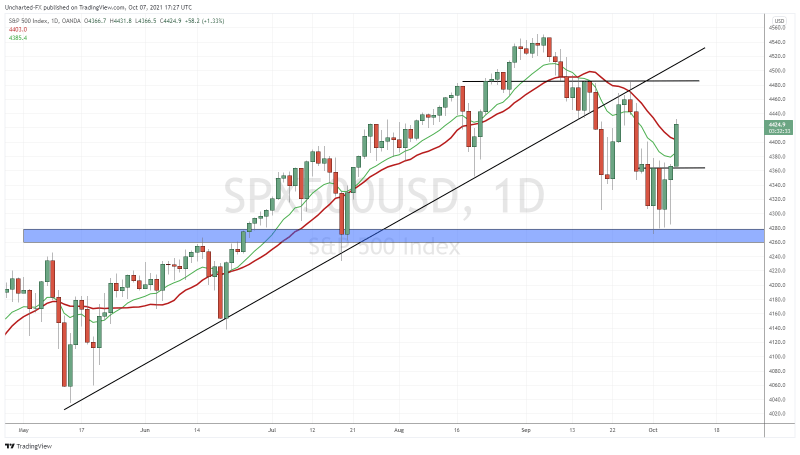
We have been ranging for 5 full trading days at the major support of 4280. Yesterday saw a really strong buy as evident from the large wick. Overnight we broke out, but I will show that to you on the 4 hour chart. By the way, the lower high is still at 4480. So we are by no means in safety just yet.
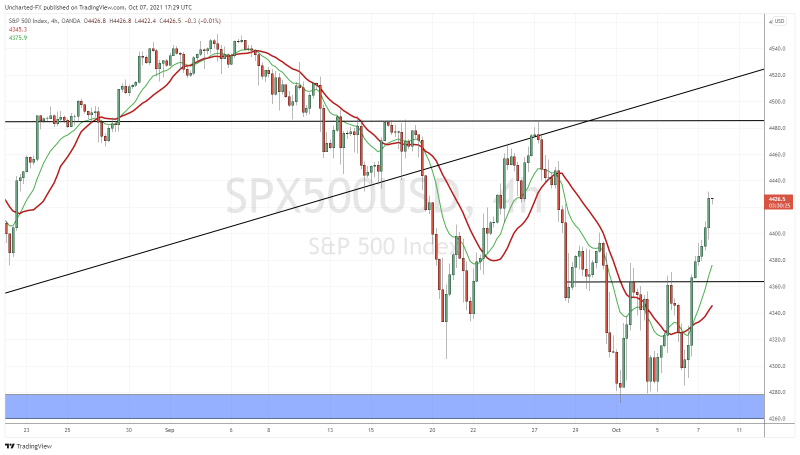
But this 4 hour chart is what led me to take a S&P long contract overnight. Our triple bottom, or range, confirmed a breakout with a close above the 4370 zone. Nice follow through. I see some resistance here at 4440, but we remain bullish in the short term as long as price remains above 4370. I want to see that push to 4480 tomorrow, and an eventual break back above it. We shall see how markets react tomorrow.
The Nasdaq is also indicating bullish momentum:
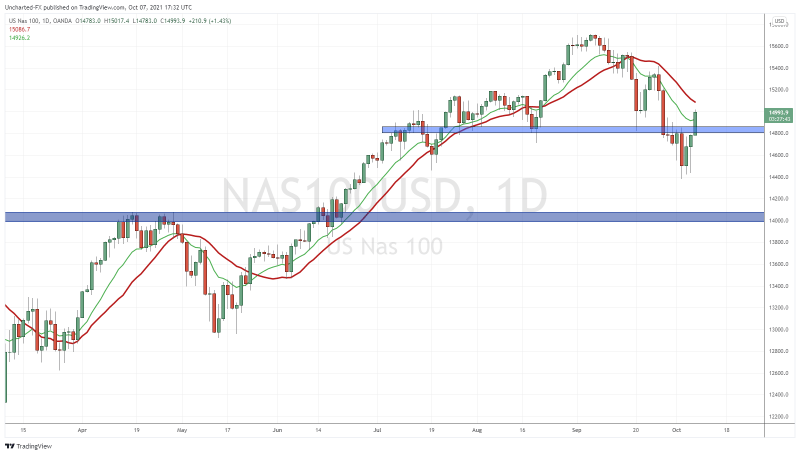
We have a 4 hour double bottom on the Nasdaq, and now we are getting a daily close back above 14,800. We still have a few hours in the trading day, but a close like this would help the bullish case.
A few other signs indicating Stock Market strength? The US Dollar is down, Bonds are down (money leaving the safety of bonds and heading to stocks or cash or other assets), the VIX is down, and the Japanese Yen is down (Yen pairs are up).
But here is the really strong bullish point for me: China.
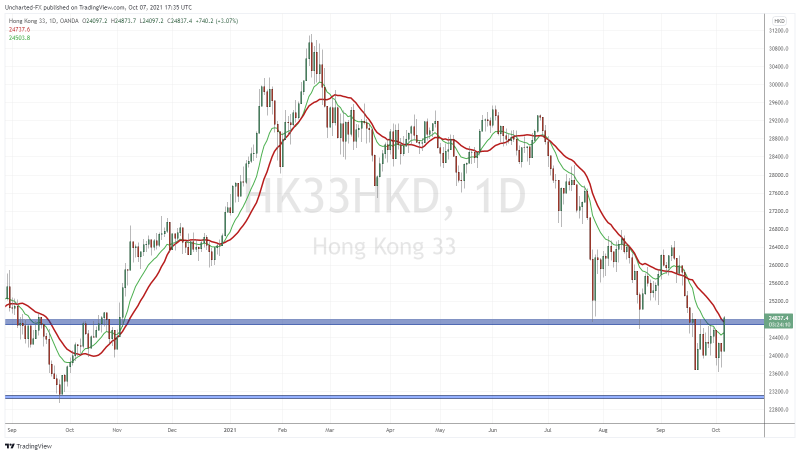
The Hang Seng has been in a bear market. Yes, it has dropped 20% from its highs. The downtrend with lower highs and lower lows are obvious by observing the chart. Now things look ready to turn around. Why is this chart important? Evergrande and major Chinese tech companies are listed here. If Chinese stocks seem ready to reverse, it would help to ease investor fears.
The 4 hour has broken out.
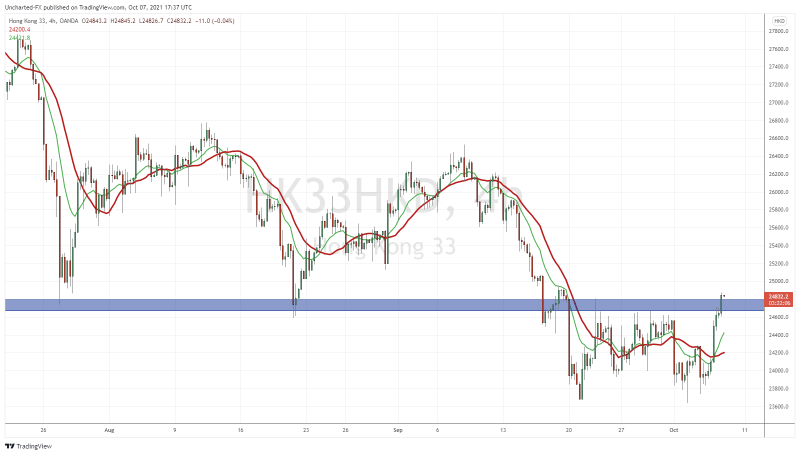
Now that’s a nice close above resistance. I might be longing the Hang Seng, the first time in years. I will be watching to see how the Hang Seng moves when China re-opens and jump in on a trade evening time on the West Coast. If we get a nice pop, then I expect US markets to continue to climb into tomorrow.