Remember when Oil was THE story? The recovery play, plus geopolitical issues. With tons of moves in commodities, it is almost easy to forget that Oil has had a great 2021. Natural Gas is currently making headlines with storage shortages and cold weather approaching. Not a good combination, especially over in Europe. Overall, energy has had a spectacular year.
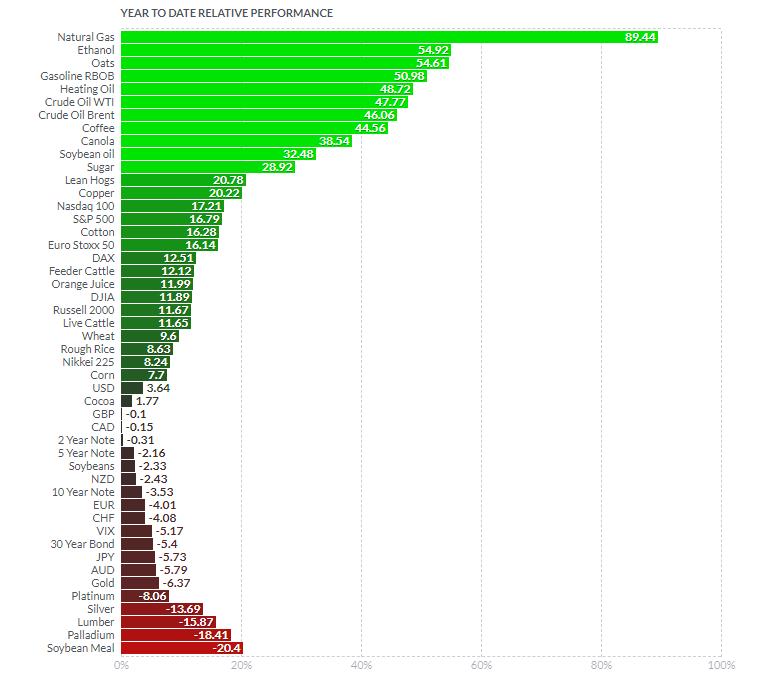
Year to date, energy makes up the top of the pyramid. Only the almighty Oats has a rip similar to energy.
As great as these numbers are for energy traders and investors, things might be getting better. For those who are apart of the middle class…not so much.
We will be paying more for heating our homes this Fall and Winter (here in BC, Natural Gas prices are rising by $1 per gigajoule starting October 1st), but also for fueling our cars. More of those inflationary pressures. What I am worried about is rising food prices. I mean it is already happening, but if fuel costs rise even more, then businesses will have to increase costs due to rising transportation costs. That inflation isn’t looking too transitory.
Long time readers aren’t surprised by this. We are in a situation where there is people with more money competing for the same number of goods and services. Even though government money kept people afloat, money did not go to increase productivity. This is a key sign for rising inflation now and ahead.
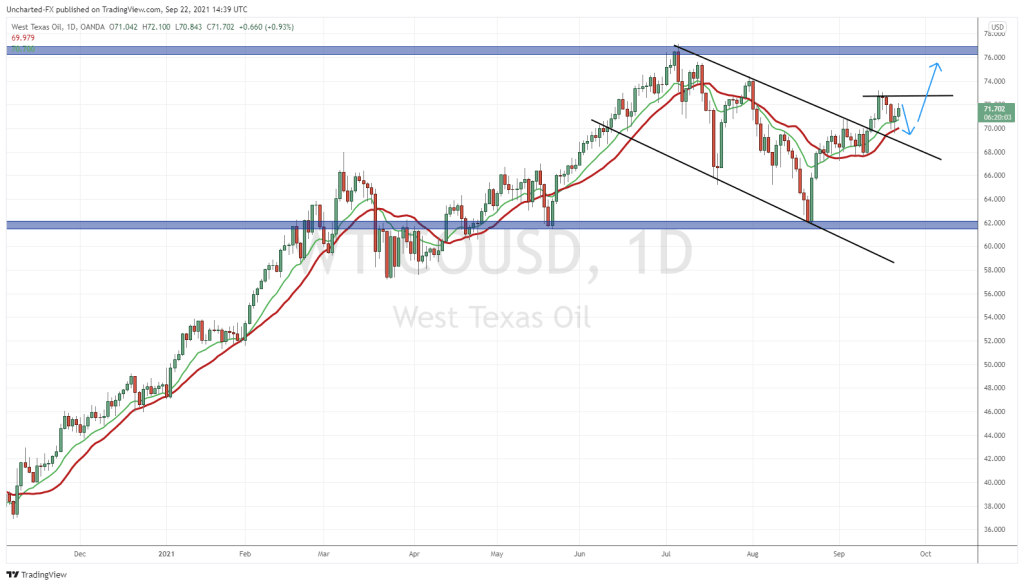
Oil prices have been ranging between a bullish flag pattern from July 6th to September 10th. This flag was then broken. What is a bullish flag you ask?
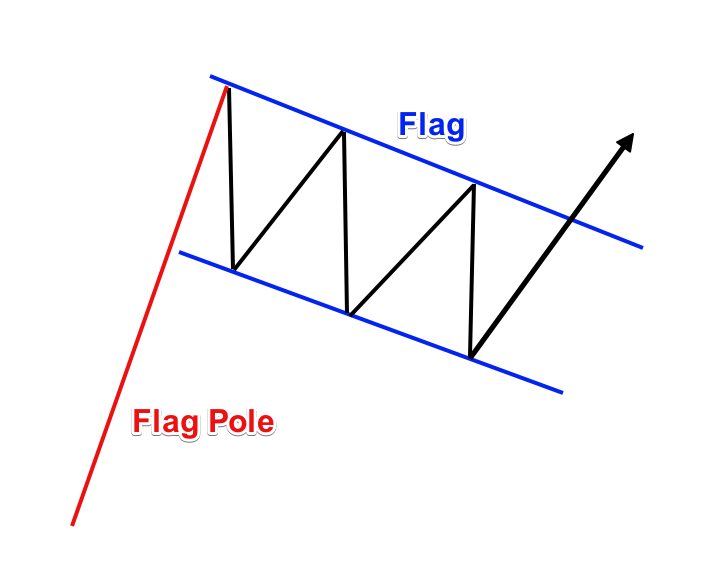
Looks just as it sounds. A situation where after a price rip, the asset ‘ranges’ not as a flat rectangle, but a slanted one. It makes it appear as a flag on a flag pole.
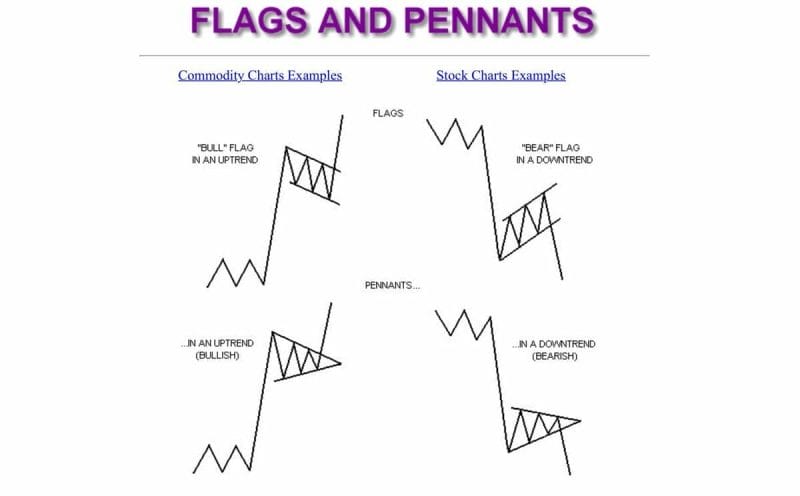
There are all sorts of flag, so get used to seeing them.
Now that you are experts on picking out flags, let’s move onto Oil.
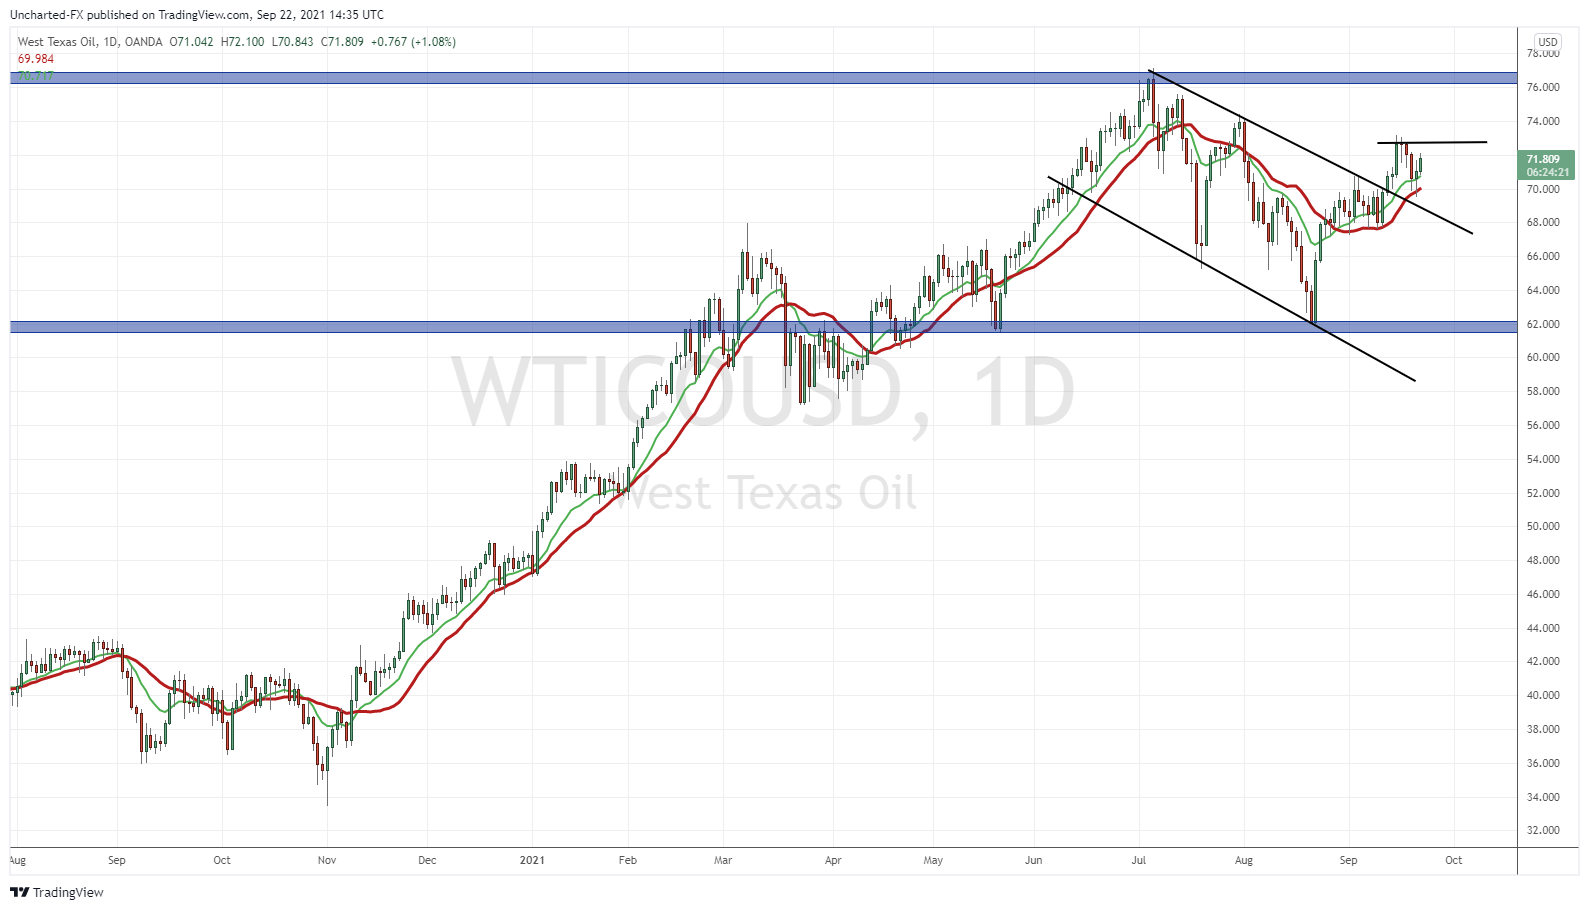
This is the West Texas variety, but Brent crude has a similar structure.
The flag was broken September 13th. We had two days of pop and then stall. With the market drop, Oil sold off too. An everything sell off. Now we are finding support at the $70 zone, plus meeting my Moving Averages, BUT more importantly, we have a retest of the flag breakout.
Just like every other pattern, a retest after a breakout can be expected. It provides an opportunity for buyers to enter the new trend in case they missed out on the initial technical trigger. Alternatively, if the retest fails, then we can confirm this breakout was a fake out and that the bears are fully in control.
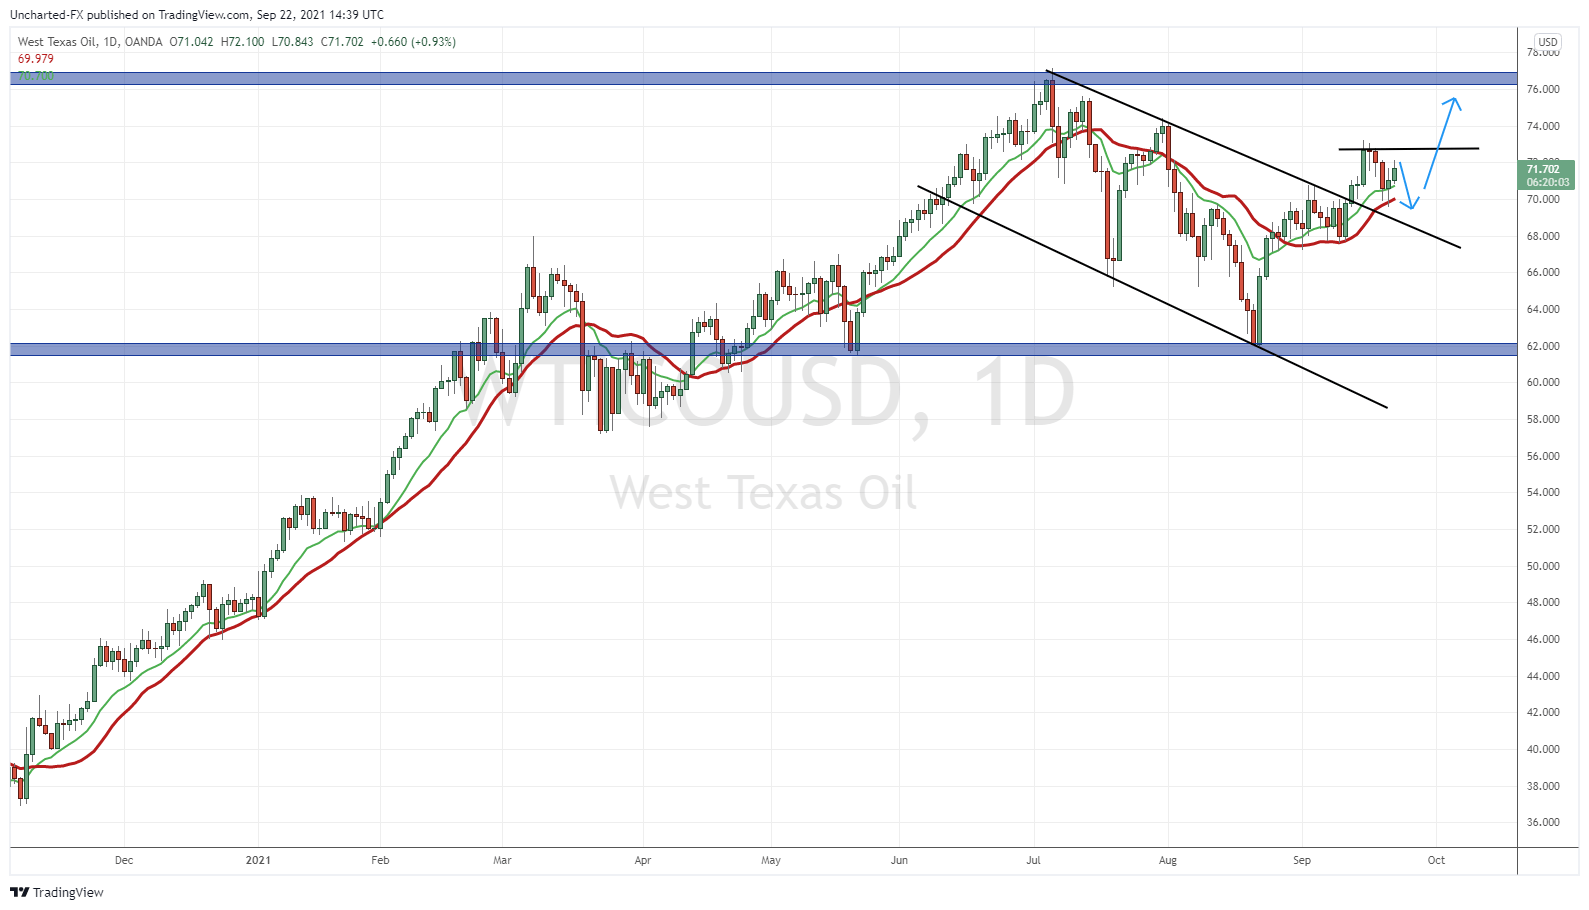
This is what I am expecting, with the arrow down portion already occurring with the current retest. The major trigger break will be taking out recent highs at $72.72. Then we move up to our major resistance at $76. And if that breaks…actually I want to say WHEN that breaks, we are looking at $90 Oil.
What could be bearish Oil? More major lockdowns as the cold weather approaches. However we may not get a repeat of Oil hitting negative prices especially if China remains open. Not saying this will happen, but we are already seeing rising Covid cases in the West, and this likely worsens as we head into the Fall and Winter.
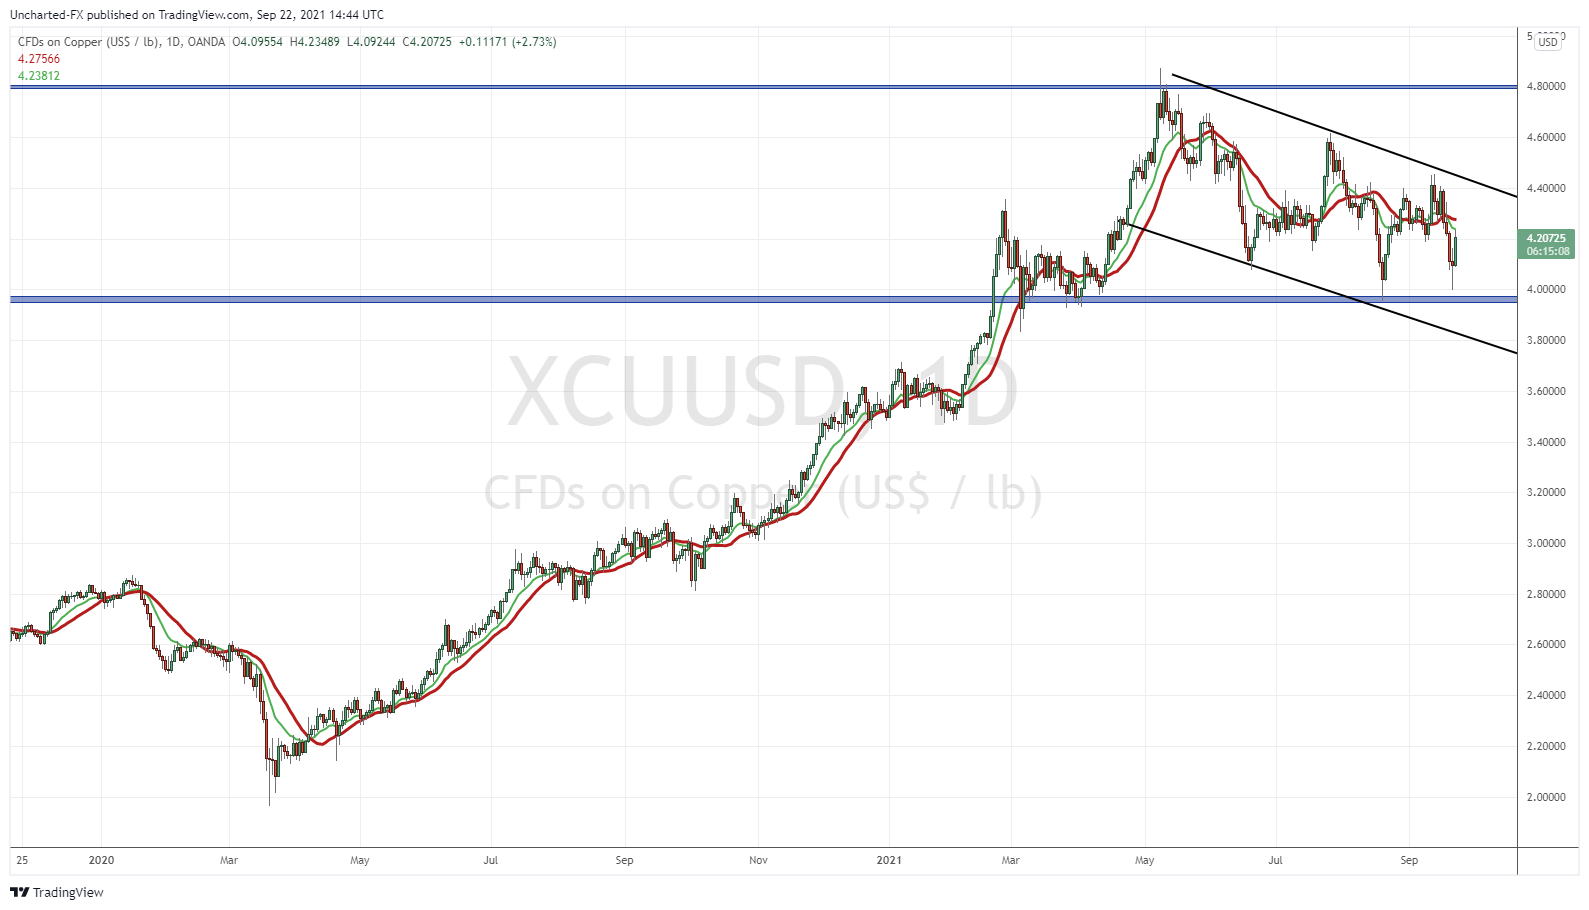
As a bonus, let me show you Copper. Another flag! Interesting as both Copper and Oil were seen as the recovery plays.
