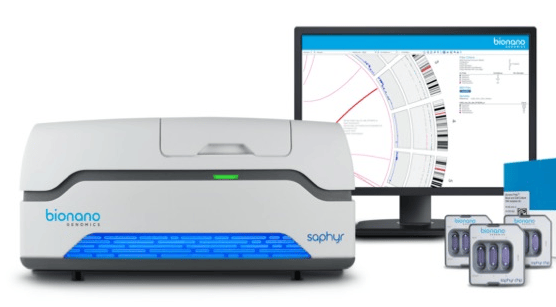
Bionano Genomics operates as a life sciences instrumentation company in the genome analysis space that provides tools and services based on their Saphyr system to scientists and clinicians conducting genetic research and patient testing and provides diagnostic testing for those with autism spectrum disorder and other neurodevelopmental disabilities through Lineagen, their wholly owned subsidiary.
I will be the first to admit that their industry is far beyond my circle of competence. This does not deter me from trying to analyze their business model but warms me that no amount of marginal safety from my average purchase price can protect me from uncertainty.
That uncertainty is no reason to completely discount the stock from your watch list but should be a sign that other experts and credible sources should be used sparingly.
Luckily for me, Equity Guru’s Reza Golzadeh and Kieran Robertson have published two great pieces of content that go through most of the basics of what’s going on with all the science. I strongly recommend checking out their links.
To Invest or Not: Bionano Genomics (BNGO.Q)
Bionano Genomics (BNGO.Q) under the microscope, taking a look at a company you may have missed
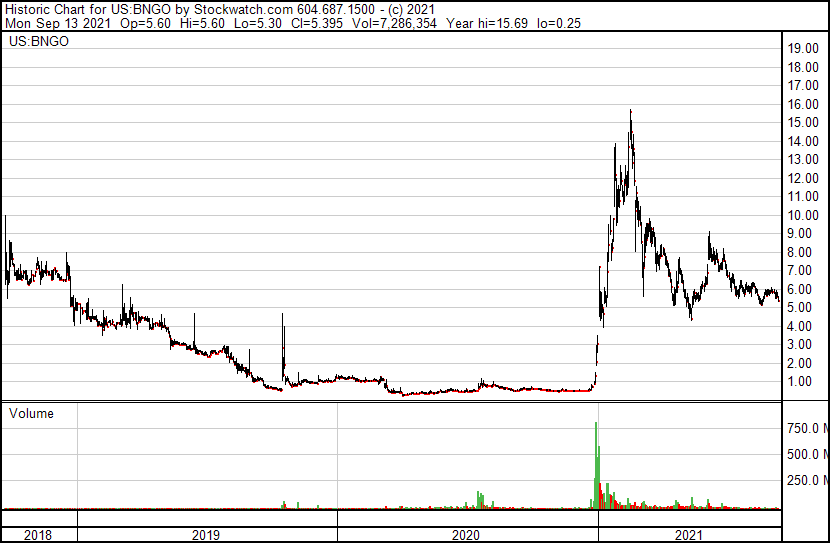
I know you’re not reading my article to get a PhD in life sciences so let’s get straight into the common stock. Bionano Genomics is a US-based company that’s traded on the NASDAQ and has a current price of 5.37 dollars per share. At current valuations the market cap is $1.5 billion with a 52-week high of 15.69 dollars per share and a 52-week low of 0.47 dollars per share.
Over the last five years the stock is down 23.25% and on September 21, 2020, was trading at $6.99. In December of 2020 the stock went from 0.54 cents per share to a peak value of 13.57 dollars per share in February meaning the stock ran up by just over +2000%.
This sort of volatility presents opportunities for investors especially those who are well prepared to hold during long periods of no activity. On top of the volatility, the company also has negative operating earnings meaning there is greater uncertainty to its valuation as investors consolidate most of the information from their quarterly reports and annual statements.
I rarely ever use charts because of my lack of experience using them successfully but my dear friend and coworker Vishal Toora has given his 2 cents(more like a billion cents in value) on the matter in his latest article titled Chart Attack: Bionano Genomics (BNGO.Q) Reversal Pattern Printing?
All in all, this means the stock has opportunities for both investors and traders alike to exploit value from the stock. For those more interested in the business side of things that is what I will try to tackle from the perspective of a private owner buying a small interest in a partnership.
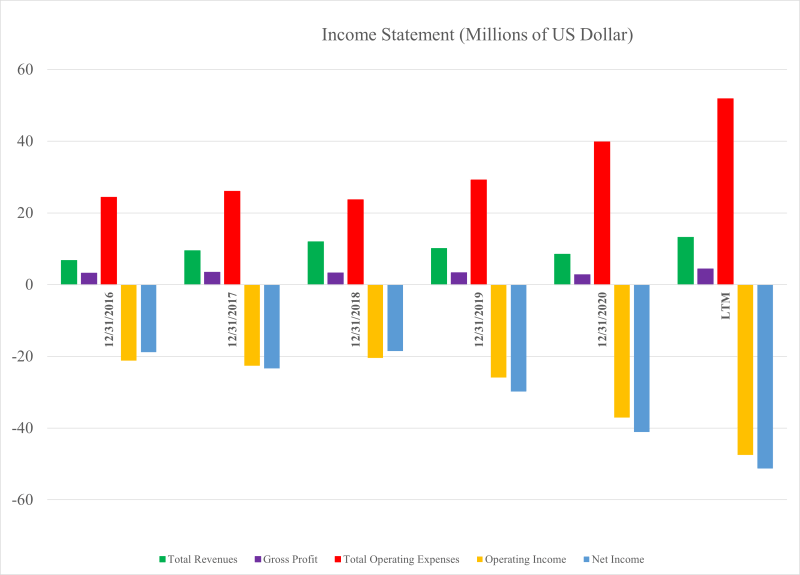
The first thing we would do as private owners would be to look at the general trend over time of the business is fundamentals specifically its income statement. Lucky for you I’ve taken the time to collect the data from 2016 until the last 12 months for the company’s income statement.
What we notice is that
- the green bar which is total sales has fluctuated over time but is showing a general uptrend and the same could be said for gross profit margins indicating a working business model with the great book of business behind them
- the scary red bar is the total operating expenses basically what it takes to run the day-to-day operations of the business and reinvest into research and development including the sales and marketing team.
- because of the scary red bar, the yellow bar which is the operating income which reflects the health of the underlying business is on a downtrend as the business expands its business and needs more manpower and resource is to keep up with the scale
- the last blue bar is the net income attributable to the owners of the business before paying dividends and after taxes. Usually, this number would be reflected on a per-share basis but since we’re looking at the business as a private investor, we will look at the aggregate number.
In summary we have a business in the life sciences space that is growing its book of business and expending a lot of money on its operating expenses to sustain the scale and invest in future cash flow. Now that we know the Birds Eye view of what’s happening in the business, we need to know who’s making all the executive choices.
David L. Barker, PhD is the chairman of the board and has served since May 2010 as a director of the company. Doctor Baker also serves as a director of AmideBio, Singular Genomics and Aspen Neuroscience. In his academic career, Dr. Barker conducted interdisciplinary research in neurobiology as a postdoctoral fellow at Harvard Medical School, Assistant Professor at the University of Oregon and Associate Professor at Oregon State University
Erik Holmlin, PhD is the president and chief executive officer off Bionano Genomics. His experience includes positions at GenVault Corporation (CEO), Exiqon A/S (CCO) and Becton Dickinson. Erik was a National Institutes of Health postdoctoral fellow at Harvard University and a National Science Foundation predoctoral fellow at the California Institute of Technology, Pasadena (Caltech)
Lastly, we have Mark Oldakowski who is the chief operating officer. Mark has a 20-year history of success in the development of systems for the life sciences and medical device industries. Prior to joining Bionano, he led the global team at brook life sciences systems in the development of sample analyzes, high throughput screening solutions, and chemical storage and biobank systems.
This is the team that will be leading our company to future success. Of course, it is very difficult to know if the quality of management is high just based off looking at their history, but it is sure a great way to have a reference point or base level for what managements capabilities could be. In their latest quality reports management indicated that:
We expect to continue to incur significant expenses and operating losses as we:
• expand our sales and marketing efforts to further commercialize our products;
• continue research and development efforts to improve our existing products;
• hire additional personnel;
• enter into collaboration arrangements, if any;
• add operational, financial and management information systems; and
• incur increased costs as a result of operating as a public company.
This should be the basis of how we judge their performance in the future as they implement their operational strategies. To do this a quick example from their latest reports would be to look at their income statement and their balance sheet just to see how it’s changed over the last six months from May 2021 to June 2021.
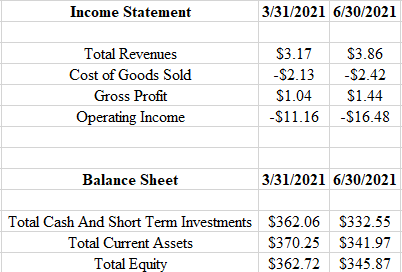
In line with their goals of commercializing more projects they have increased their book of business and have more sales since the previous quarter. In May of 2021 they had $3.17 million in sales and in June of 2021 there are $3.86 million of sales.
As management has predicted their cost of producing their goods has increased slightly from 2.13 million to 2.42 million and they have booked a gross profit of 1.04 million in May and 1.44 million in June. This improvement in their gross profit could be due to the increase of their total revenues at a higher clip and the increase in their cost of goods sold or said in a simpler way an ability to generate more business whilst maintaining a certain level of operational efficiency to produce the final service. As we go lower on the income statement, we notice that their operating income was negative 11.16 million in May and negative 16.48 million in June of 2021.
Although this is not a positive side of business operations it is in line with their commercialization and development stage as they redeploy money into research and development and a sales force that would distribute their products. overtime we would hope that their ability to generate sales income and control their cost of services would lead to operational leverage.
Usually, the balance sheet tells the picture of the financial position but in this situation the business is really what you get its cash. Should be noted that in May they had $362 million in cash and in June dead $332 million in cash. between this period most of their cash was used for capital expenditures are 50,000 and paying off debt at $17.01 million.
Seems like the guidance that management has given us about the increase in operational expenses and the increase in operating income losses is true. We should also note that the business is cash-heavy and most of the total equity is funded through cash and other working capital. Most people would say in this situation that the next catalyst would be some sort of acquisition or investment in organic growth. How successful this would be very hard to tell and would have to wait until the next quarterly reports to know what the management is doing with their fat cash pile. As for now this is a stock, I do not understand because of the industry it is in but I appreciate that the business model at some level is working.