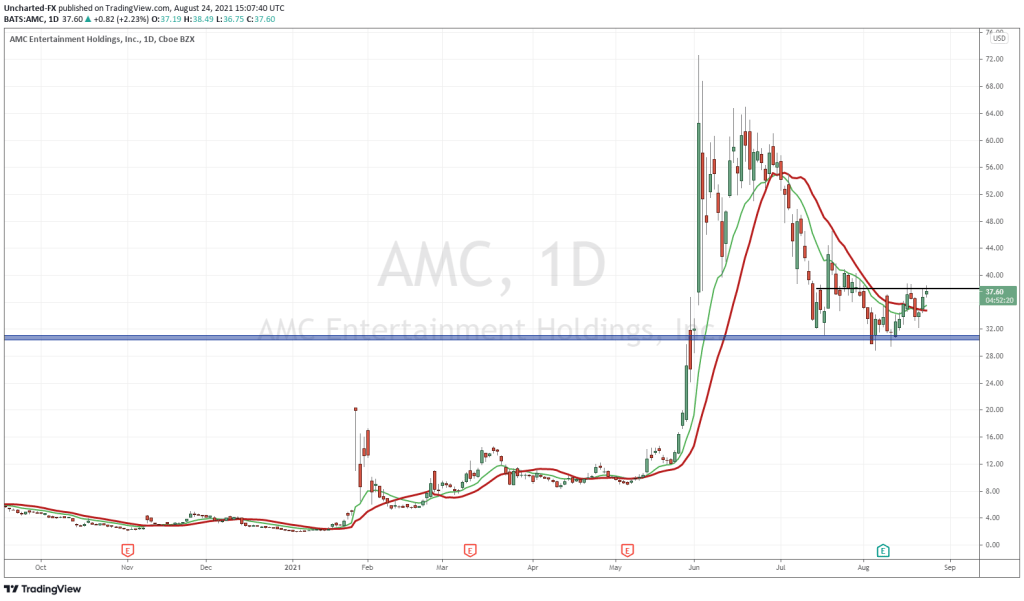
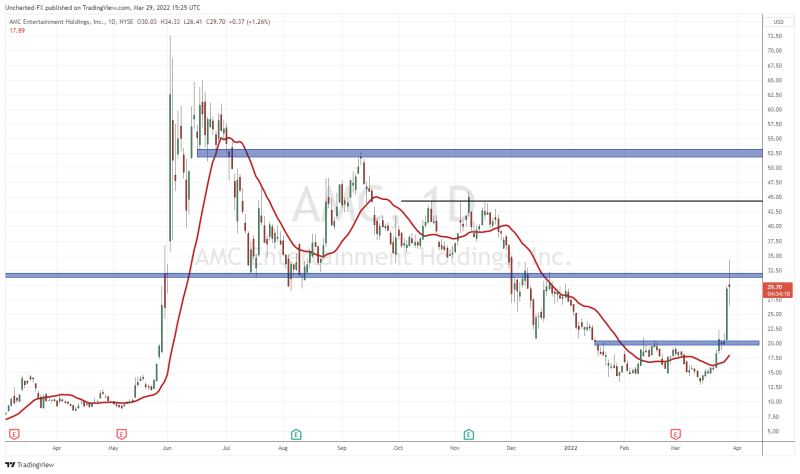
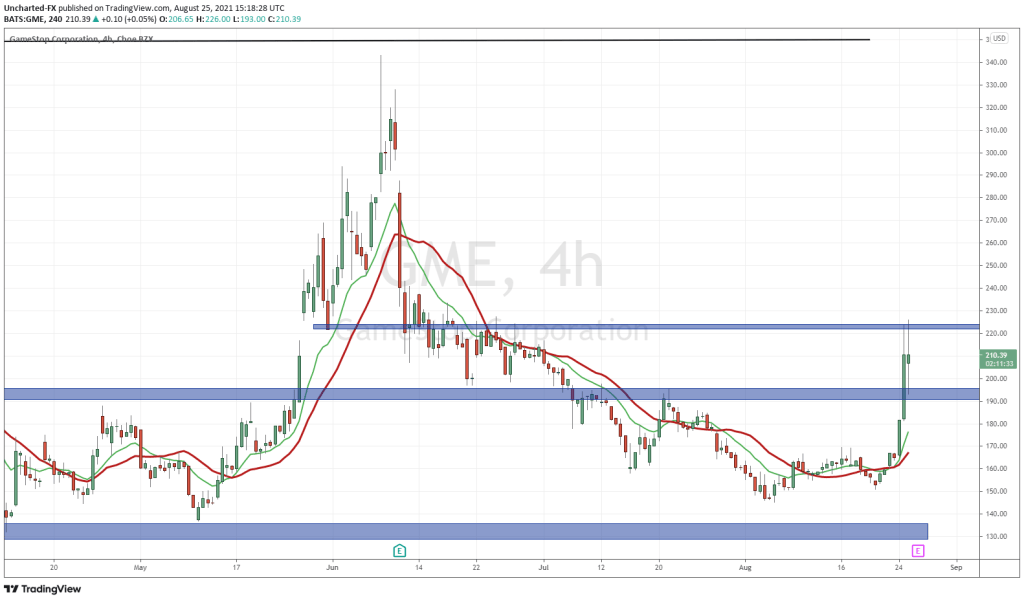
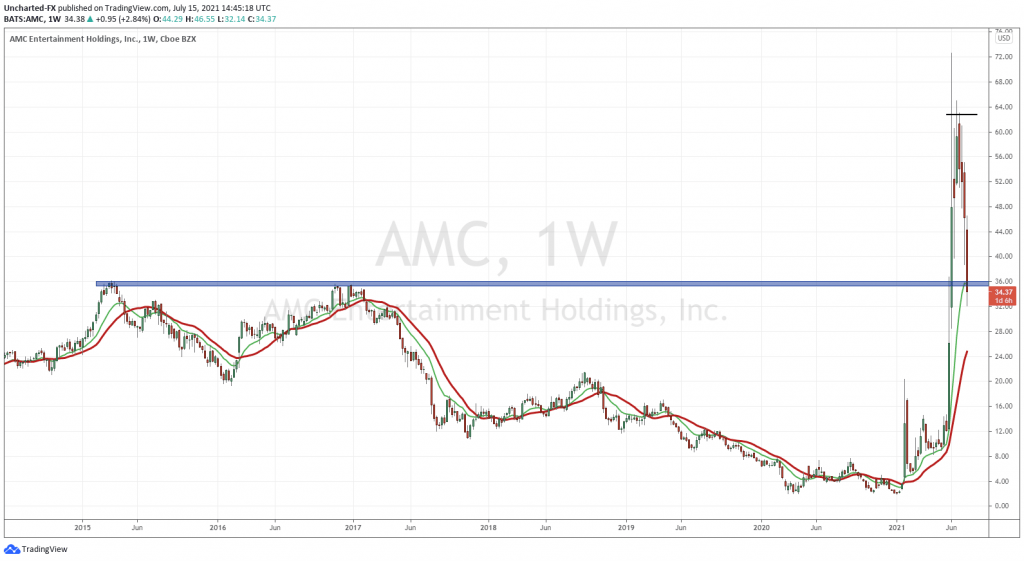
It seems the apes are back at it. Loading up on AMC Entertainment. And for good reason. AMC has one of the best looking technical set ups right now.

One crazy thing I just realized today: how epic the average volume is on AMC. 169,430,167 according to Yahoo Finance. Just in comparison, Apple is 77,413,671 , Tesla, Facebook and Microsoft all see average trading volume around 20 something million. Meanwhile GME is not seeing much anymore, with average volume dropping down to around 5 million. Maybe just interesting facts to some people, but I was a bit shook from this info.
On the fundamental front, the financial media is saying that AMC is getting a bid due to the Pfizer vaccine getting FDA approval. Okay sure. Maybe that will make people feel safe again going to the theatres. I am more of a technical guy, so to me there are cycles. Media just likes to find a reason to back up price action, when it just isn’t required. I myself have been to the theatre twice in the recent months. Check out the new Fast and the Furious movie, and then checked out the recent Suicide Squad movie. Both screenings had a very decent crowd. People will be going back to theatres for that experience. AMC Entertainments recent earnings surprise attests to this.
We know AMC is sitting on around $1 billion in cash which they got from a raise. The CEO has said he wants to expand and open new locations, and even begin to play live concerts on screens. They have a lot of cash, but it seems the movie theatre chain just bleeds out the cash.
On the fund side, some interesting battles between the bears and the bulls. Jim Chanos, the famous short seller, picked up more puts against AMC. Meanwhile, Jim Simons over at Renaissance Technologies, one of the most successful hedge fund ever, tripled its AMC stake to $103 million. I find this particular piece fascinating because I believe Simons style is similar to my market structure. He found a way to model it for his algo’s.
Technical Tactics
Now that we have some points out of the way, let’s get back to the charts, and why AMC is one of the best looking charts.
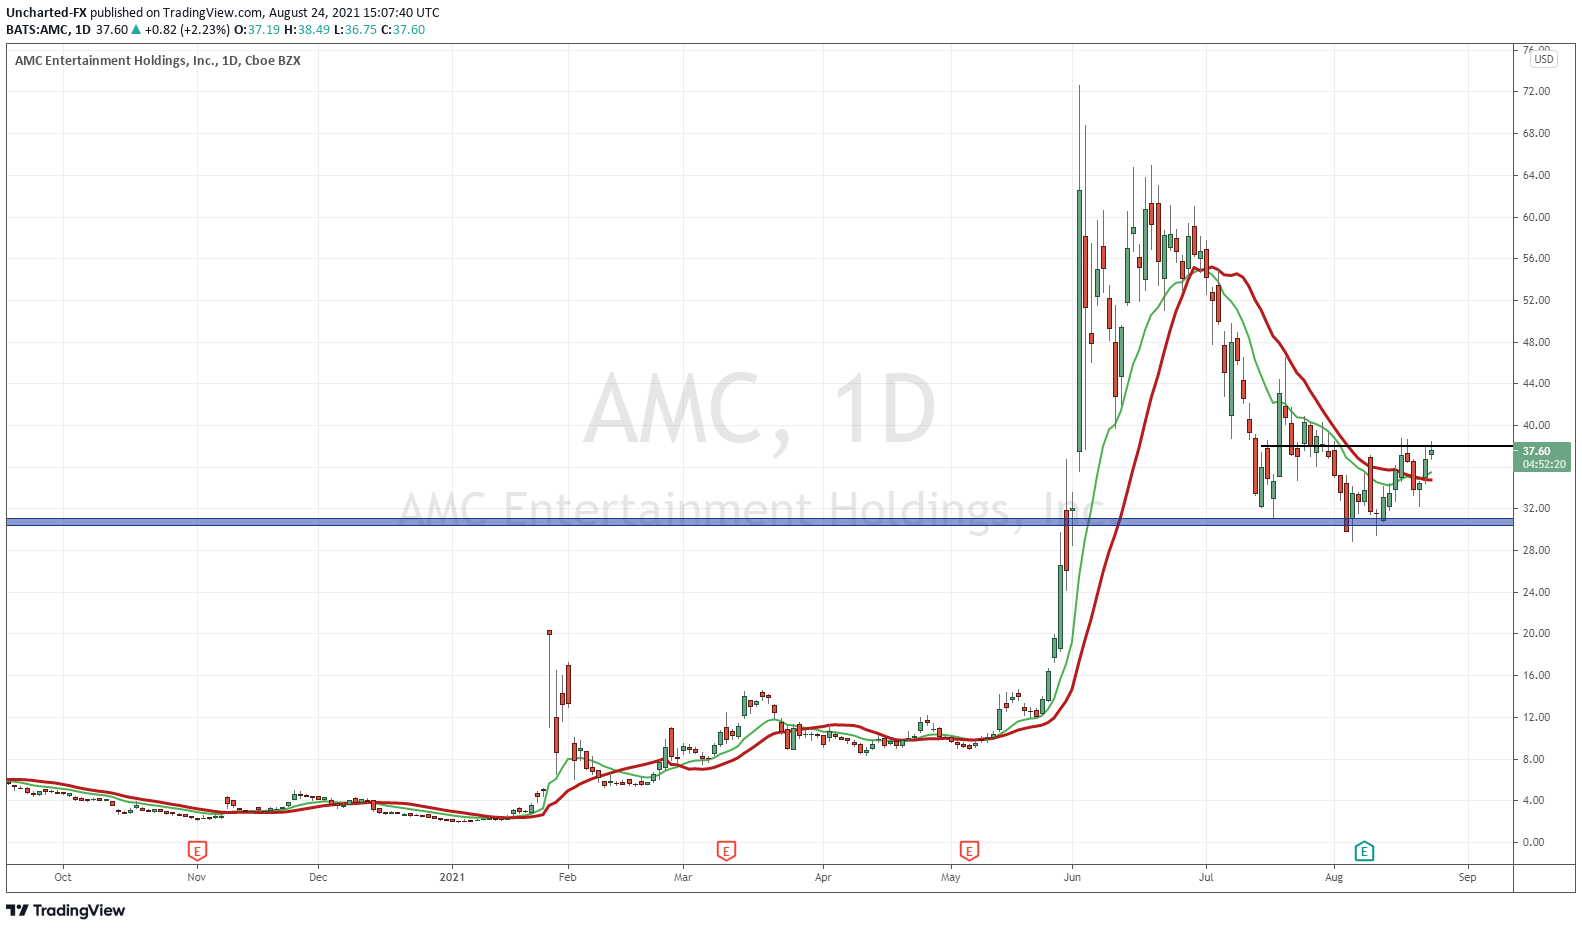
Look at that beauty. According to market structure, there are only three ways all markets move: uptrend, range and a downtrend. In the trends, we tend to see at least TWO swings (either higher lows or lower highs). More swings are possible of course, but when we see two, we put that chart on our radar looking for reversal signals. These reversals tend to happen at major support and resistance zones we call flip zones.
AMC meets all the criteria I look for. Been in a downtrend, we are now ranging/basing at a major support zone around the $30 zone. Now we await the trigger which is the breakout. Can we decide to enter earlier? Sure. But the risk is the stock just continues to range longer…or even breaks down taking out $30. That would suck. If we wait for the breakout, we may miss out on some of the move, but the probability of a successful trade increases. Since trading is a business of probabilities, we want to wait for the breakout to align as much confluences as we can.
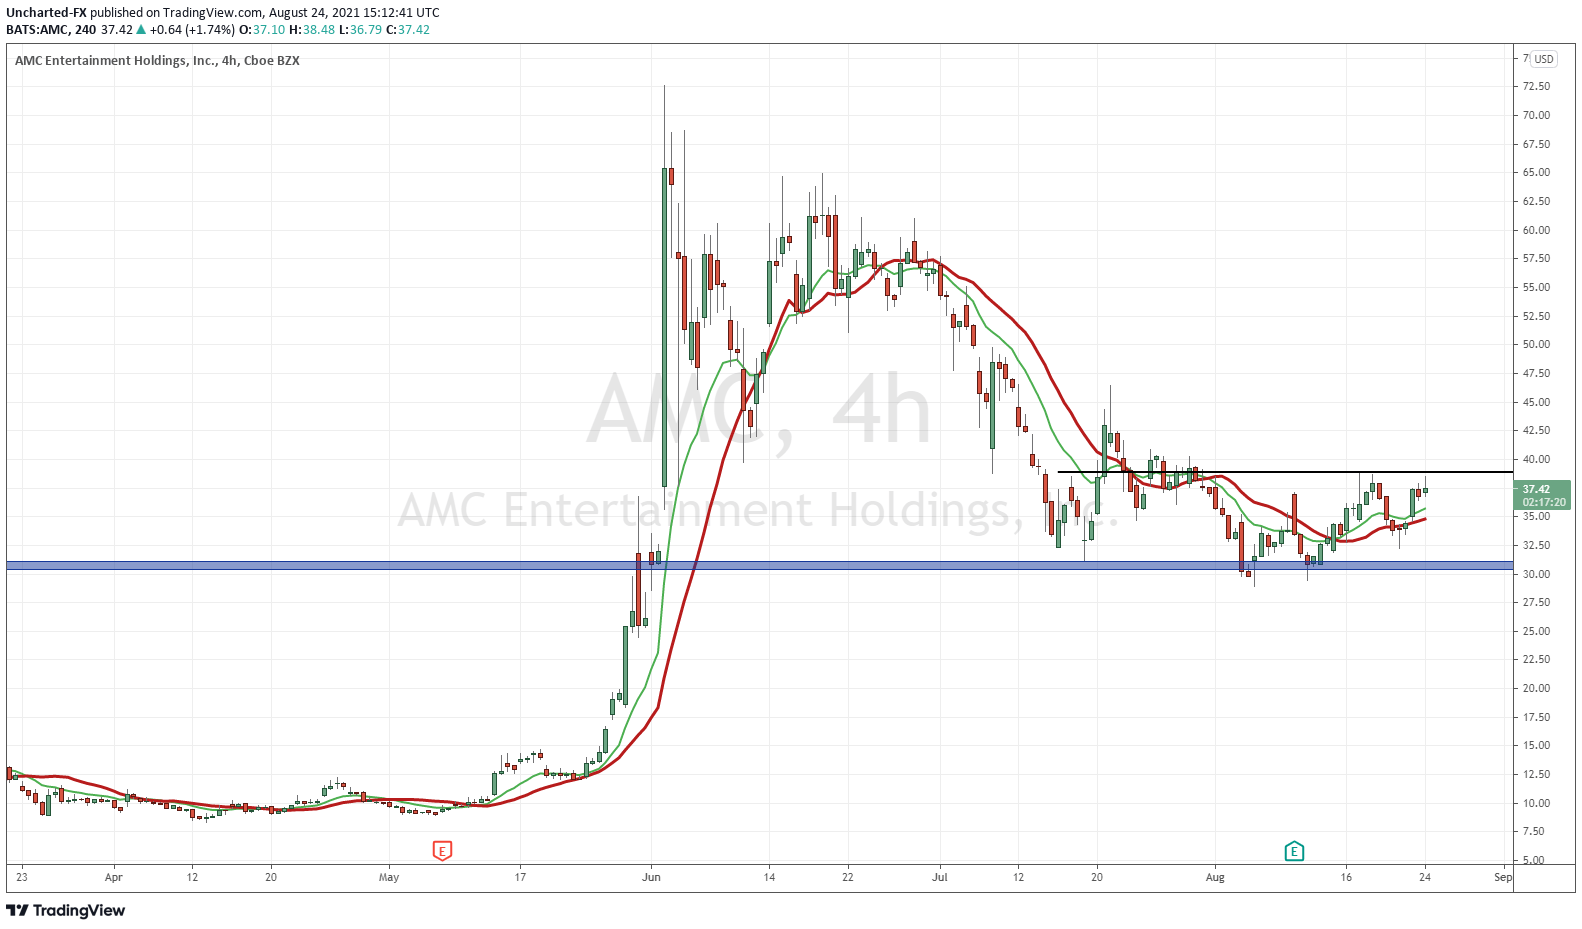
If you are eager on AMC, I would watch the 4 hour chart for an early entry. At time of writing, we will have a 4 hour close at 10 am PST in about 1 hour and 45 minutes. See if we get a breakout. But the daily close is better.
If this breakout occurs, the first target zone would be around the $52 area. There is resistance there. But when these meme stocks have a pop or breakout, we tend to see momentum and follow through. a breakout could very well take us back to the $60 zone, close to previous all time record highs.
The big market moving event is upcoming: Jackson Hole. But watch the Russell 2000, or the US small cap index. We have been using that on determining whether the meme crowd are chasing small caps or crypto’s. If the Russell takes out 2260, AMC will have some momentum to fly!

