
As discussed per Monday’s and Tuesday’s Market Moment posts regarding the markets, we were watching for that break of support on the three different US Indices. We achieved it on the Dow on Monday. It was a trigger to short the market. However, in the recent trading environment, I have seen the indices either only make one move down, or RETEST their breakout zone before continuing lower. A typical break and retest pattern that is one of the keys for swing trading and even day trading on the intraday charts.

So let us walk through the price action and remember, this can be used to trade ANY asset. It could be a cryptocurrency, the debt markets, junior miners, individual blue chips, real estate, they all share the same market structure.
Right off the bat, we could see the stock markets were in an uptrend. We have all witnessed this incredible recovery. All trends are composed of what we call swings. In the case of an uptrend, we have higher low swings. Price just does not move up in a straight line, it moves up and then pulls back as people take profits, before getting a bid up again for those who are following the trend. As the saying goes, “the trend is your friend”. You do not want to heavily short the markets when the trend is moving up. Sure, you can get some pips and profits playing the pull back, but you want to align the probabilities in your favour. Generally, this means you want to trade with the trend.
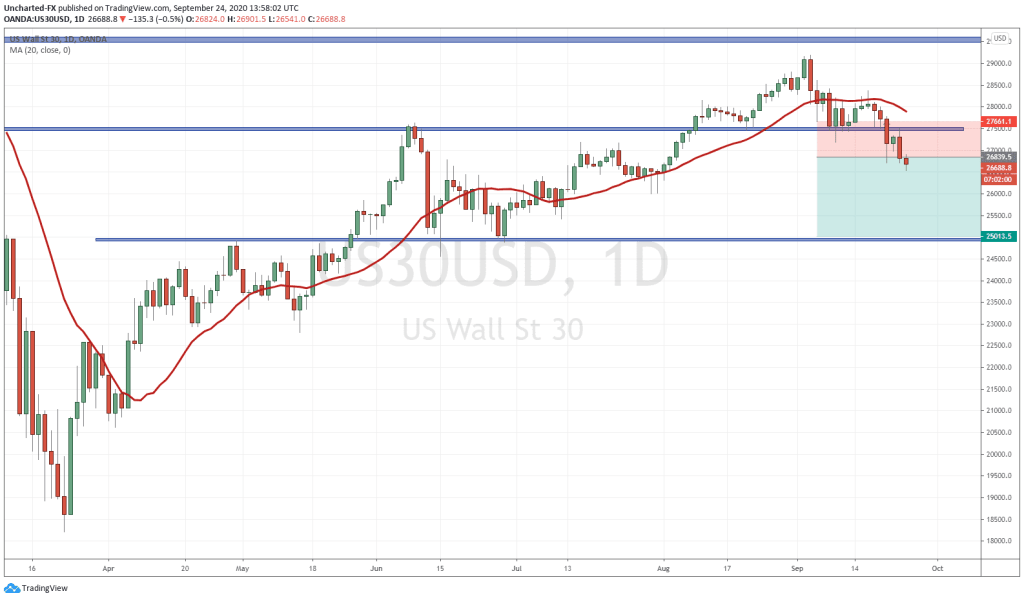
My niche has been to recognize market cycles. I realize that trends do not move up or down forever, they reverse. When trends are about to reverse, they generally give us a pattern and indication that the current trend is exhausting. We watch for this to occur at key support or resistance zones. These patterns can be a range, a double top or bottom (a “M” or “W” shape pattern), or, and personally my favourite, the head and shoulders pattern. Just like we see here on the Dow Jones.
Now this is the important part: these reversal patterns are not triggered unless we get a breakout. In other words, we must get a candle close below or above the breakout level to trigger the trade. There are times when we see a reversal pattern, but price rather continues the trend by bouncing from support because it did not close below to trigger the pattern. We seen this recently with the Nasdaq, as there was a head and shoulders pattern on the daily chart, but price did not get that breakdown below until yesterday.
So we got the breakdown on the Dow on Monday. That could have been a short sell entry for you, with a stop loss above the daily highs. But as I said earlier, especially on the equity charts, we have been seeing retests or fake outs so I prefer to be more cautious. Tuesday we got that retest taking us back up to our support NOW turned resistance zone. Again, another chance to enter, but you would accept the risk of a loss since you do not have the confirmed rejection. You would enter on this front running sellers coming back, and you would also get a nice risk vs reward entry.
Yesterday was the confirmation that we indeed rejected this zone. A nice daily close which also closed below the candle body lows for the past two days! For me, that was my trigger to initiate a short. You can see my set up with a 1:2 risk vs reward ratio. I would watch to see how price reacts at the 26000 zone, as there is some support there too.
There are a lot of uncertainties right now, and what keeps these markets propped: cheap and easy money, may not be seen until after the US elections. We are seeing the Democrats and the Republicans have differences coming up with a stimulus plan. Could be political as the Democrats do not want to give President Trump a win, but could backfire as it makes them appear as if they are holding the country and the middle class hostage for their politics.
On the Fed side, the Fed will likely not make a major announcement until after the elections, so now the November FOMC meeting. They are apolitical, and do not want to “boost” markets to help the incumbent.
The narrative of the real economy recovering is losing steam, as jobless claims came in at 870,000 versus 850,000 expected for the week end of September 19th.
Fears of a second covid wave and more closures are weighing in. We have seen incredible new measures being imposed in the UK…the FTSE has fallen, but there is also the huge uncertainty of BREXIT over there.
In summary, I trade the charts that I see, not the ones I want to see, and even though I think markets are going higher in the longer term, this technical pattern cannot be ignored. Expect some volatility with political headlines from now until the first week of November.
Remember: in the end, regardless of who wins the election, we will still be getting cheap and easy money. This won’t change, and the markets will soon realize that. In fact, I would argue Joe Biden would be stock market positive as it would mean even more cheap money with the Democrat social programs and spending.
Let me leave one chart here for you to watch.
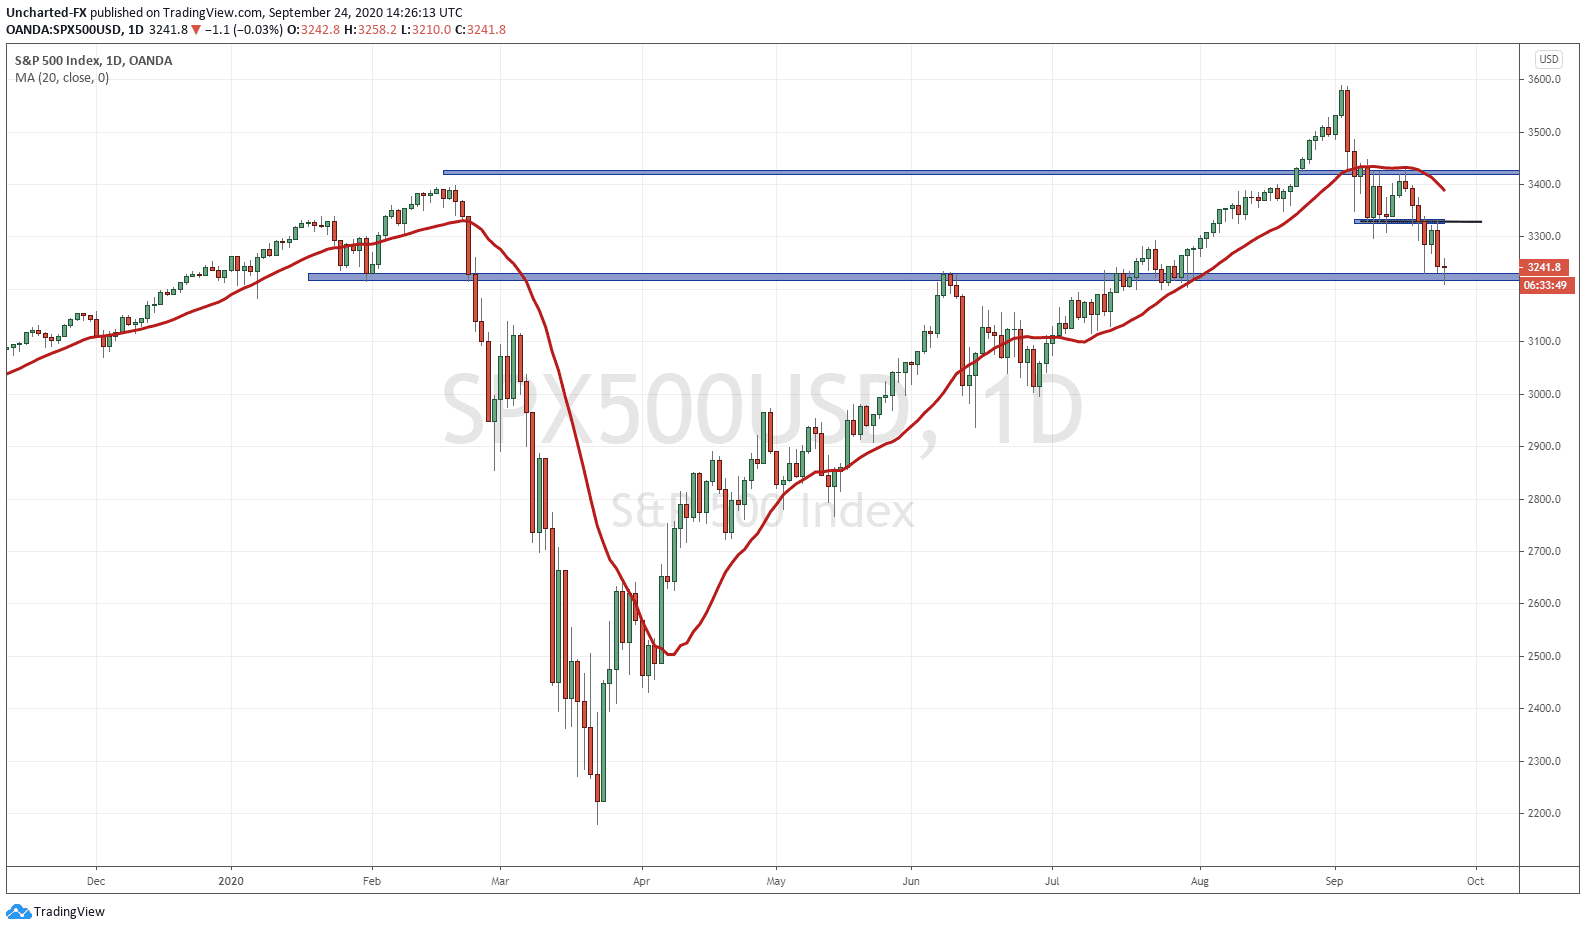
The S&P 500 has done the same: broke below support, and rejected resistance. However, we are now at a new major support zone. If the markets were to bounce…it would be from here. Watch to see what type of daily close we get today. Will be break below indicating further move lower? Will we create a doji which could mean more range or indecision at this zone? Or do we print a green candle, depending on its size, could indicate buyers stepping back in?