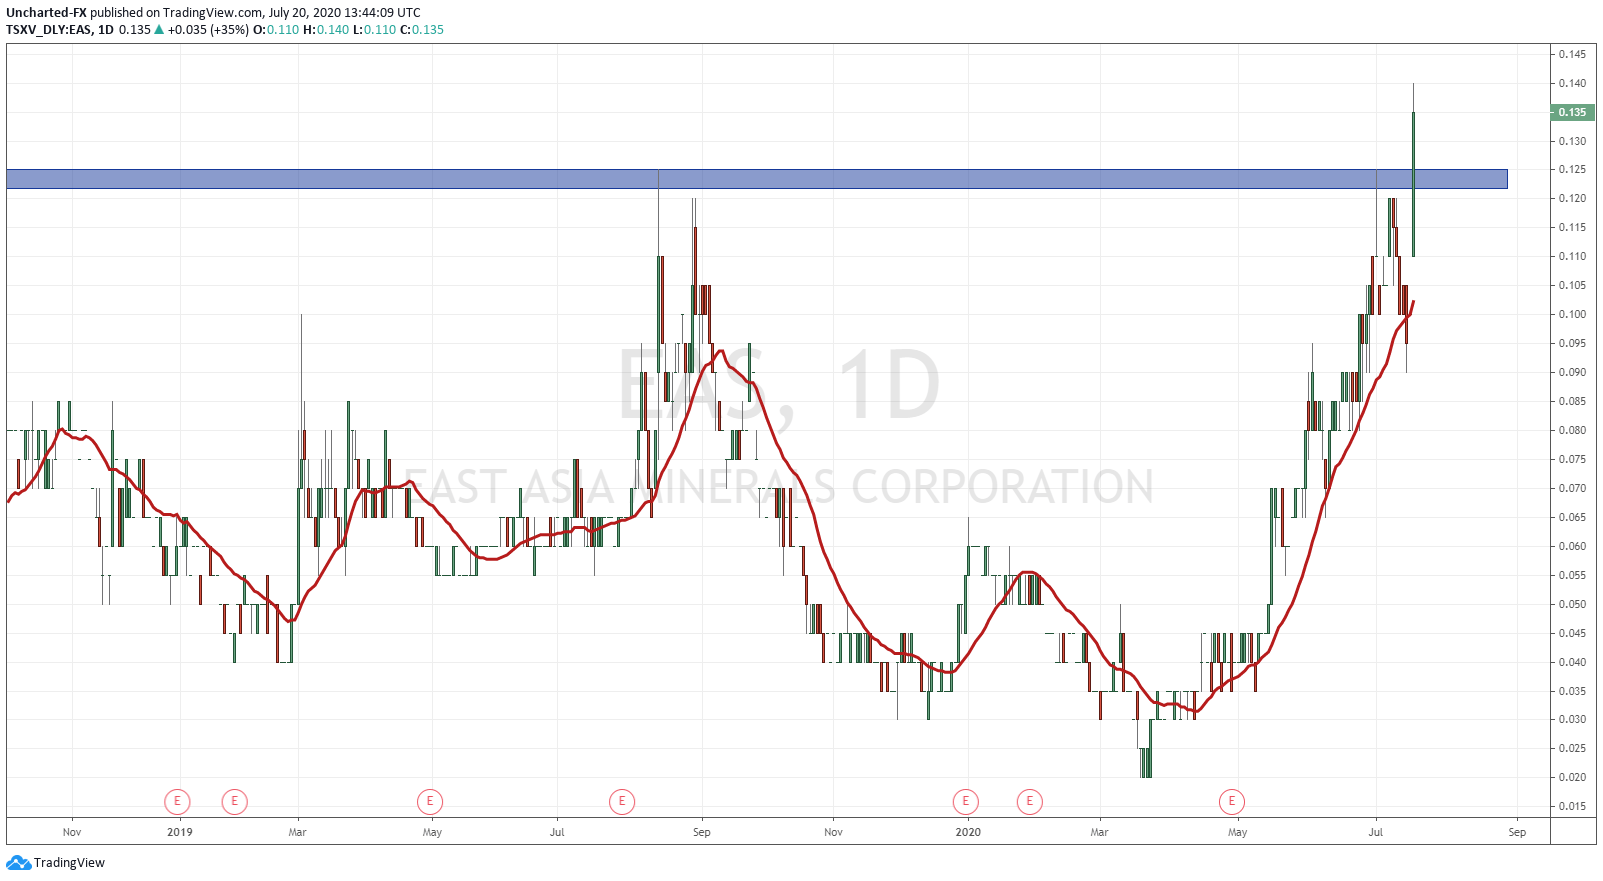
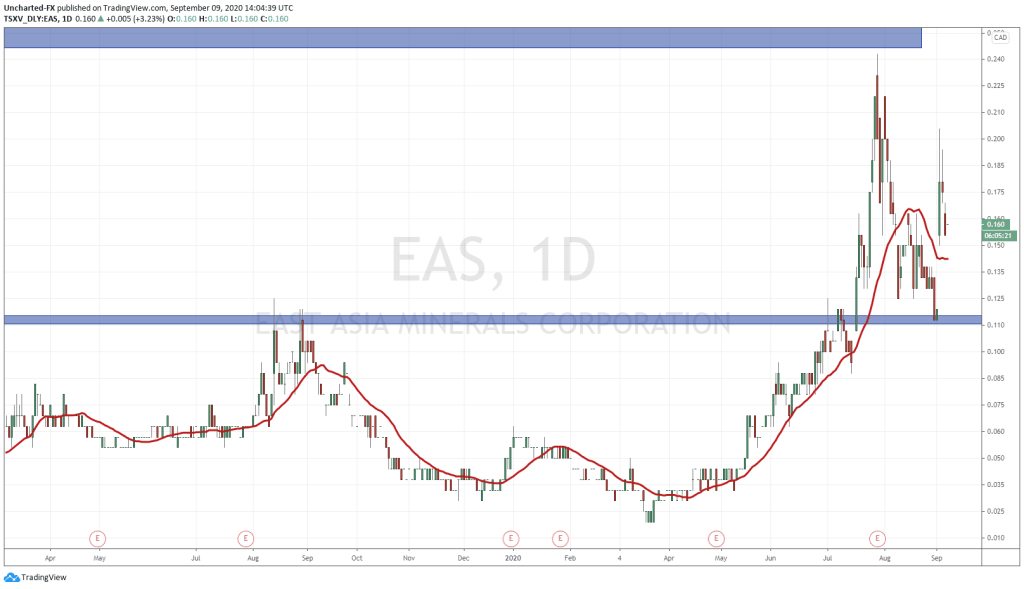
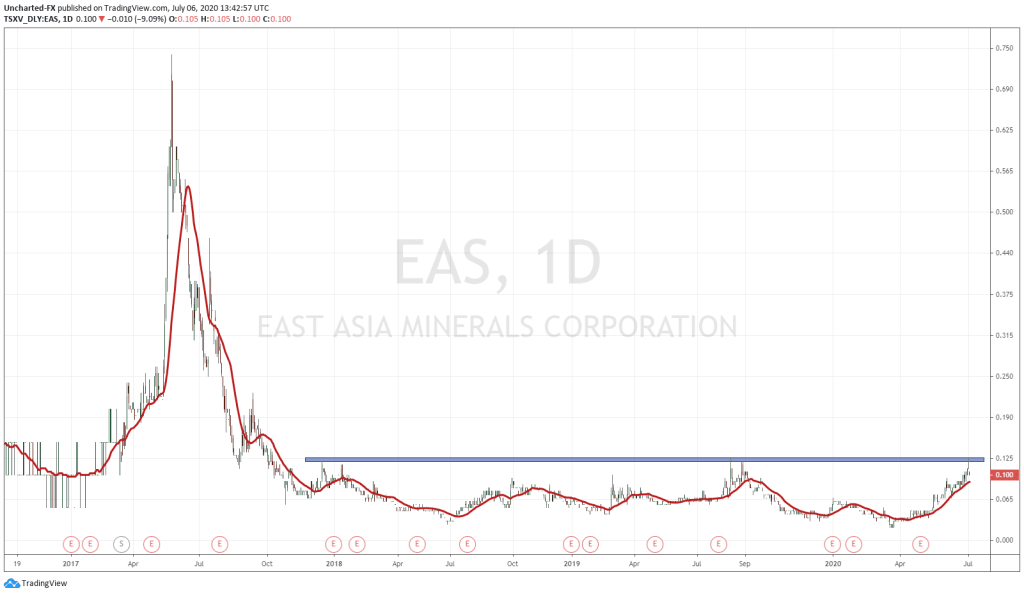
We have been patient as technical traders, but in the end, it will be worth it. East Asia Minerals has been a stock that has caught my attention and I have put out a few Market Moment posts regarding the chart. The game plan was laid out. We were just waiting for the breakout to be confirmed on the daily chart. And what a confirmation we got on Friday. Strong volume (1,791,331 shares traded vs average volume of 262,963) and a strong candle.
I am a technical trader who looks for market structure patterns that just keep repeating themselves. My job is just to look for these set ups and enter them once the pattern is triggered. However, knowing the fundamentals of a company, and potential catalysts for the stock, is a way to enter before the pattern, although you do take on more risk. In the past, our writers here at Equity Guru spoke about the fundamentals of East Asia Minerals, and a certain catalyst.
What was that catalyst? The Environmental Presentation and Permit (AMDAL).
Greg Nolan has spoken about East Asia Minerals in his roundup article stating:
“With two highly prospective projects located in a country boasting truly spectacular Tier-1 deposits—Grasberg’s 67 million-plus ounces in gold reserves being the standout—East Asia’s Indonesian projects are beginning to attract attention.”
Regarding their Sangihe project, Greg has said:
“The 42,000 hectare Sangihe Gold Project—two blocks covering the Taluad and Sangihe Islands located between the northern tip of Sulawesi Island (Indonesia) and south tip of Mindanao (Philippines)—is the East Asia’s flagship.
The company has its sights set on a modest heap leach production scenario at Sangihe. We should see the first gold pour within 6 months of government approval.
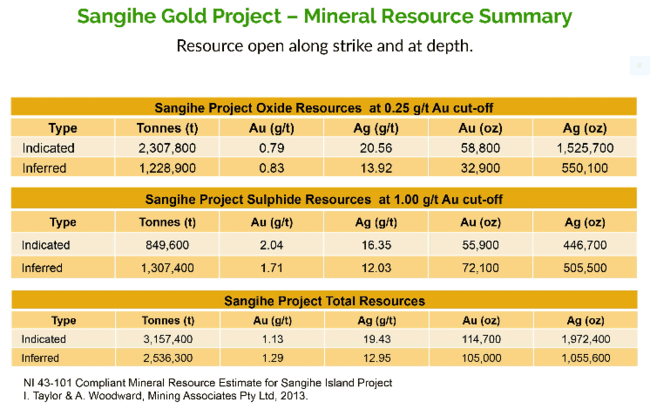
Sangihe’s near-surface, easily exploitable resources are as follows:”
As Greg stated, news on the AMDAL was due anyday. On Friday, East Asia Minerals gave us an update on the AMDAL and also on a $100,000 financing:
“East Asia Minerals Corporation (”EAMC” or “The Company”) is pleased to announce that the final environmental assessment study (AMDAL) has been submitted to the relevant environmental office in the Province of North Sulawesi. EAMC is anticipating the approval of the AMDAL and it to be issued by the authority within two weeks of this submission.
The approved AMDAL, together with the Indonesian Feasibility Study (IFS) from August 2018 which has been approved and completion of financial obligation to the government, are the requirements to upgrade the Sangihe Gold Project license to production operation stage.
Once EAMC obtains the production operation license, anticipated to be in Q3 2020, the Company will start on production financing and next steps to bring the Sangihe Gold project to operation.
In support of the preparation of the AMDAL permit, the Company will issue 909,091 worth of shares at $0.11 unit price for proceeds of $100,000 (the ”offering”) to top up AMDAL related professional fees, mining reclamation planning process at Sangihe, and working capital expenditures relating to the AMDAL.”
The market loved it. Not only did this provide the catalyst I was looking for, but just take a look at the strong candle close:
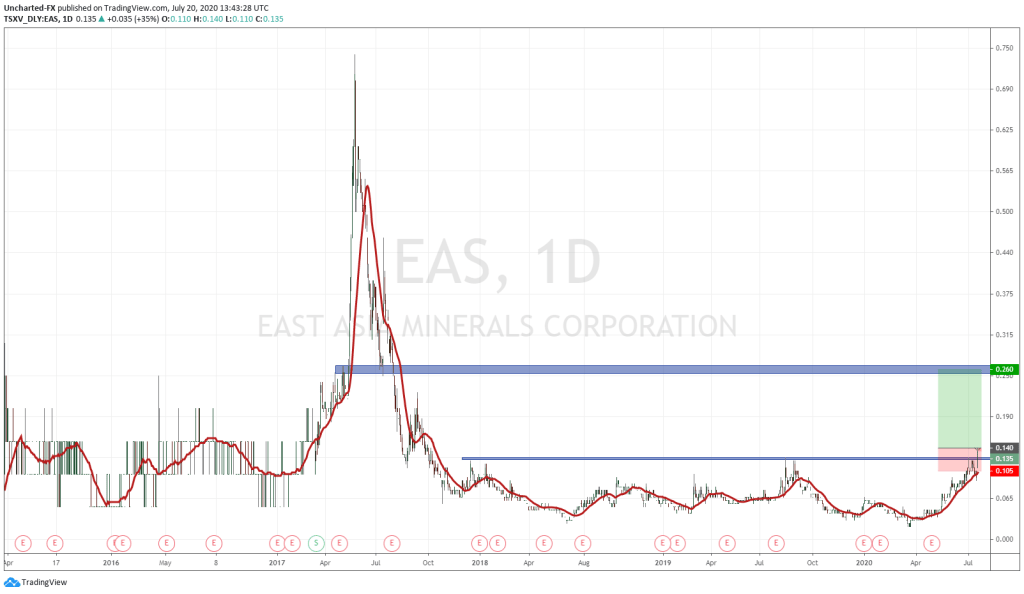
The chart shows the ⅔ market structure stages. All markets move in three ways: a downtrend, a range, an uptrend. That’s it. Our job as traders is to figure out what stage we are in and use that to our advantage. Personally, I like to look for the exhaustion of the current trend and look for reversal into the beginnings of a new trend. EAS chart had a long downtrend and a long range/base which it finally broke out of. The saying goes: the longer the base, the higher the space. Meaning there is a big move to come higher.
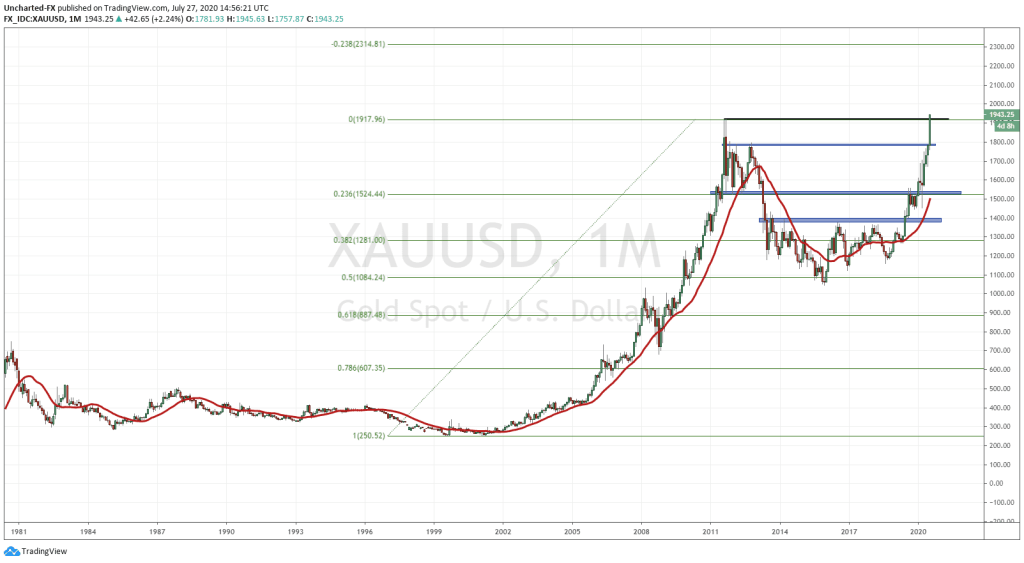
Another strong reason I enjoy this particular chart pattern is that we have seen it play out in the same sector three times already! Gold, GDX and GDXJ all displayed the same set up! You can read more about that here and here.
In terms of playing this: EAS is in an uptrend as long as it holds the breakout candle and the breakout zone (resistance now turned support). There is a possibility that we WILL pullback to retest the breakout zone after a move higher. This is normal price action. Breakouts tend to retest support before continuing higher. If we see this retest, it will provide a good opportunity for us to add to our position, or for those to enter their first positions that is if the retest is successful.
As a trade you can see by my chart that I am targeting the 0.25 zone as it is the only other flip zone we can use (an area that has been both support and resistance). The target gives us a 1:3 risk vs reward ratio. We will assess how the chart reacts to that zone for further steps, but 0.50 would be the next zone I would watch.
Good chart, and good fundamentals strengthened by the GDXJ breakout I have spoken about (similar chart pattern!) and the continuing Gold strength. You all know I am bullish on Gold, and I do think the metal will be buoyed due to the confidence crisis in governments, central banks and the fiat currency all of which are exacerbating. Plus the fact that Gold will become the new Bond in terms of running for safety if we are predicting negative interest rates in the US and other western nations that have not followed Europe yet. It won’t make sense holding Bonds for yield, although they are great to buy now for capital appreciation if central banks will take rates below 0. Bonds are supposed to be held by funds mostly for the yield…and if that is not happening then Gold could be the better run into safety. Not only is it the best currency as Ray Dalio suggests, but it can move more than 3% a month so there is the chance to make a return. If funds even allocate up to 5% of their holdings into Gold…we will easily be above $2000.

