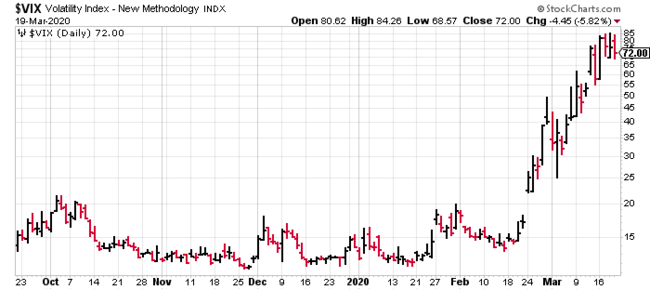
The across-the-board market volatility witnessed in recent sessions has been nothing short of astounding.
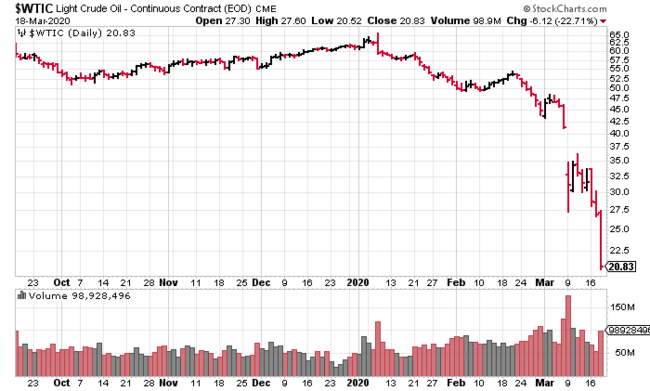
Example: The lifeblood of a number of nations around the globe—Oil—did one jaw-dropper of a cliff dive yesterday…
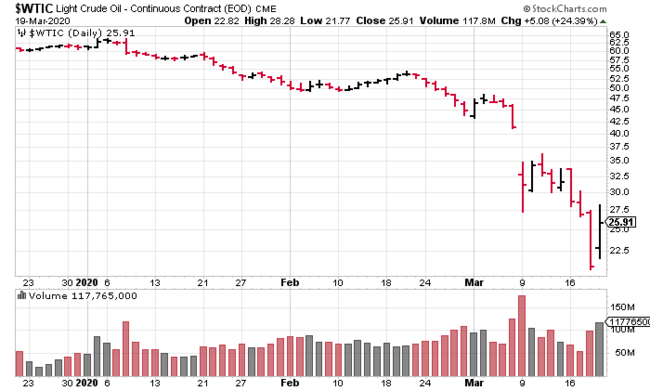
Then, only 24 hours later, Oil put on a show that would’ve made even Ed Sullivan stand up and applaud (a close-up 3-month view of today’s price action)…
The price bar on the extreme right of the above chart represents the largest one-day percentage gain in NYMEX history.
So the excessive weakness in the Oil market has finally come to an end, right? Things will become sane again, yes?
Bloomberg article Mar. 19 – The Idea of Negative Oil Prices Is More Realistic Than You Think
I’m familiar with negative interest rates, but negative oil prices?
“U.S. oil futures just hit an 18-year low as an oil-price war between Saudi Arabia and Russia rages on, and that has a few traders and analysts wondering whether physical crude prices — in at least some parts of Canada and the shale patch — could actually drop below zero. It’s a rare but not impossible feat.
Case in point: In the aftermath of the last major downturn four years ago, a North Dakota sour crude was briefly priced at negative 50 cents a barrel before being revised to a mere $1.50.”
Don’t show this to anyone you know living in Alberta.
The VIX (Volatility Index)
We’re all aware of the carnage around us—we don’t need to be reminded. But this is another way of looking at the psychology underpinning current trading patterns among the broader indices.
The VIX, aka the Fear Gauge, is an index based on S&P 500 index options and the market’s expectation of (30-day) forward-looking volatility.
More simply stated, the VIX is a measure of market risk and investor sentiment.
The greater the upward trajectory, the greater the level of ‘fear‘ in the market.
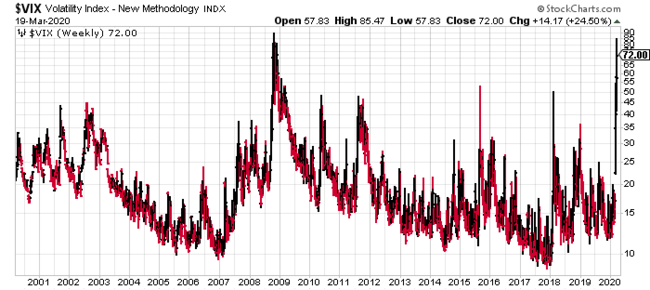
Pulling back a full 20-years on the VIX, you can see that the market hasn’t been this bloody twitchy since the height of the Lehman Brothers crisis in 2008.
Bill Shakespeare would’ve been inspired by this kind of chop. “Confusion (volatility) hath now made its masterpiece.”
But this level of abject fear is not shared by all
Earlier this week, Credit Suisse made a bold call predicting a V-shaped recovery.
Credit Suisse’s sell-side analysts believe a 15 to 20% gain in equities may be in the cards over the next 12 months.
Michael Strobaek, the Swiss lender’s Global Chief Investment Officer:
“Those whose current equity allocation has declined below the strategic level and who can tolerate the elevated volatility, should begin to build up equity positions.”
Strobaek believes there are opportunities in the IT (Information Technology) and energy sector, but warns against using leverage and being too aggressive “given the ongoing negative news headlines and the uncertainty created by last week’s historical sell-off.”
The U.S. Fed also offered a glimmer of hope today, noting that bank borrowing spiked to more than $28B this week—the largest sum pulled from their discount window since October of 2009.
“The Federal Reserve Board is encouraged by the notable increase in discount window borrowing this week with banks demonstrating a willingness to use the discount window as a source of funding to support the flow of credit to households and businesses.”
We gotta bring gold into this
By now, you’re probably aware that many of us here at Guru Central believe in gold. We believe in it even more, now, after recent events.
In a (gold) bullish piece published yesterday, we echoed a common concern:
“If gold is such a safe haven asset, why did it get sold so unrelentingly when the broader indices caught what-for?”
Our answer:
“Gold was sold because it was a source of liquidity during a liquidity event. ANYTHING even remotely liquid was sold during the panic, regardless of underlying value or safe-haven caste.”
We were also eager to note that during previous liquidity crises, gold stocks were the first to turn. During the 2008-2009 financial debacle, by the time the broad markets had bottomed in March of 2009, gold stocks had more than doubled.
Today (March 19), it was interesting to watch as the GDX pushed significantly higher while the metal itself did the square root of dick.
In recent sessions, gold may have been held back by firmer bond yields. The current yield on the U.S. 10-year note is above 1%—it was yielding 0.5% less than two weeks back.
I suspect these positive yields are unsustainable and are destined for negative territory.
Final thoughts
A quick word on market pundits: They’re a dime a dozen. They toss out predictions—where we are, where we’re headed—like so much confetti.
No one knows how events will play out over the medium to long term. Even the short term—twenty minutes from now—is impossible to predict.
There’s a lot to be said for playing it safe during these periods of uncertainty.
END
—Greg Nolan


