In our last installment, we learned that Canada’s average marijuana cultivator loses about 0.19/share per quarter and that, at least at this moment, it doesn’t really matter. Whether the equity prices have gotten ahead of themselves or not, this is a growth industry from top to bottom. All things being equal, a company’s production is a function of the size of their licensed square footage. And as long as the battle between public equities for investment capital is being fought with facility space, we might as well have a look at the relative value of the square footage of pot stocks.
Weeeeed innnn Spaaaaaaaaaace
What We’re Looking at and Why
Tracking the sizes of these companies’ buildouts and comparing them to each-other isn’t an exact science. By and large, the square footage that these companies are practically hiring skywriters to tell us about is the total size of their facility, not just the canopy area. And as far as we’re concerned that’s just fine. There’s more to the cultivation business than just growing plants, and each part of the process needs its own space. An efficient use of that space limits bottlenecks and recalls while ensuring the continuity of the product. While maximum canopy space theoretically makes for maximum yield, Health Canada told us that a facility’s capacity is limited by the amount of space it has licensed as secure storage, and that’s just the most obvious balance requirement. Ultimately, the facility is a dope machine and it’s up to its operators to build it in a manner that produces the most sellable product at regular intervals.
In the past year or so, many companies have shifted from talking about their licensed (or soon-to-be-licensed) facilities in terms of square footage to talking about them in terms of production capacity. That’s a neat trick, but the jury’s still out on how much a good operator can get out of these things consistently, so we’re disinclined to take anyone’s word on the production capacity of a facility that has yet to be built. Stay tuned for more on the efficiency of these companies facilities, but in a sneak peak, Aurora and MedreLeaf are the far and away leaders in terms of yield, and you’ll see below that they’re both working with about 50,000 square feet of facility. That could easily be a coincidence, or it could be that 50,000 feet is the optimal size. For now, this is about square footage.
Expansion is the word of the day, even as this market has softened. Each of the producers with 4 quarters of production are planning expansions, and the new licenses that are still putting together their first year of production are pushing a narrative that surrounds the square footage of their facilities. That’s a very aggressive expansion being represented by Aurora, and it’s worked out for them.
It’s important to point out here that – temporally speaking – the total expansion columns aren’t apples to apples comparisons. The facilities have different completion dates, and the nature of construction is such that hard finish dates are difficult to pin down. On top of that, we still don’t know how well these operations are able to use the knowledge they’ve accumulated in their existing space to scale to the larger space.
The Relative Values of Real and Actual
When we did our analysis of the Aurora – Cannimed merger, someone asked in the comments why Aurora picked Cannimed as opposed to another peer. The answer may well be that Aurora was looking to use the on-paper value that the market gods had blessed them with to buy the one thing they don’t yet have (at least not in volume): active production space. From our reply:
This market is ascribing a premium to planned buildout, and appears to be ignoring or at least comparatively under-valuing actual, active cultivation space.
If Aurora is after working greenhouses instead of construction sites (which makes sense; they’re future space rich and current space poor), then they’re going to be after the cultivator with the most space and the least amount of market-cap-inflating announced buildout. Both Cannimed and CannTrust fit the profile.
We continue to consider Aurora’s dogged pursuit and eventual purchase of Cannimed as an indication that active, working license square feet are fundamentally more important to companies than planned production space. Markets get excited and downright suicidal about stuff, but they usually come back around to line up with the fundamentals.
NOTE: We use enterprise value when we’re trying to look at what the market thinks of a company. This is basically a company’s market cap, less its cash. The theory being: cash is an easy thing to value. Strip it out to get a look at the rest of the business.
This chart plots the enterprise value of all of the companies we track divided by their total proposed square footage, including their active working licenses. Moving left to right, the first six are the companies with 12 months of measurable production. For the most part. Their average EV premium over the companies without production at the time of this writing is about 30%.
(Note: The Ev/SqFt charts are live. The EV component changes with the company’s market cap. We keep the square footage up to date as best we can as companies publicly update their buildout plans)
The non producers are still trying to figure themselves out by this metric. The DOJA – Tokyo Smoke merger that created Hiku has married a cultivator-to-be with a high-end coffee shop delivery system holding prime storefront, and done an excellent job of selling the market on that vertical integration, so one must account for value that isn’t cultivation space. They may not even belong on this chart.
Medreleaf and Aurora are getting the most out of their total footprints, and it’s handy to see how they all do in value/space terms, but otherwise this doesn’t tell us much. Multiplying the numbers is good for a 30,000 foot view, but it doesn’t smack us with insight. Let’s take a closer look at the pre-cultivators and see what jumps out.
De-tangling the Data – The Anatomy Of A Growth Pick
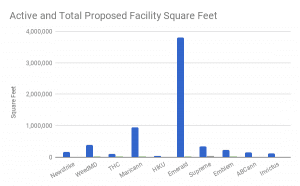
Here’s what these pre-cultivators have and what they’re trying to build:
Jeez! Settle down, Emerald!
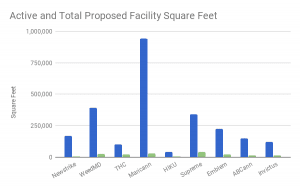
Emerald has 4M square feet of announced production space in their MD&A, and we put everything in the MD&A in the totals, but this is excessive. More on why later. For now, they’re maxing out the bass channel, and we can’t hear the mid. Let’s take them out of the mix and see what we get.
Obviously, Emerald aren’t the only ones with a long way to go until they reach their total square footage. This is to be expected for companies who are new ventures. Still, we’re seeing a disparity in enterprise value, even among companies who have similar amounts of active square footage.
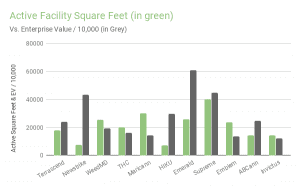
After scaling down the enterprise values by a factor of 10,000 and plotting it beside the active square feet, we start to get a clearer picture of which companies are and aren’t getting value for production space that actually has the lights on. Naturally, there’s more to consider than just facility square footage, but this chart is a great place for a fundamentals-based stock picker to go looking for mis-priced companies.
A few of these gaps are easy to explain. We mentioned that HIKU’s EV has Tokyo Smoke built into it. Newstrike had their EV inflated when they were caught up in the Aurora / Cannimed melt-up.
Take those out, and we’re looking at a few big gaps: Maricann, Emblem and Weed MD are showing active space values that outpace their EV metric. Emerald and ABCann, are the flip-side of that coin.
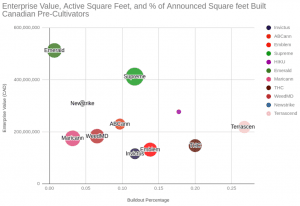
In case anyone is not yet thoroughly confused, let’s plot the whole thing on a bubble chart:

The bubble sizes scale to the companies’ active production square feet. They move left to right as they complete more of their announced square footage. Terrascend is the current leader in terms of percentage, having built just over 1/4 of their 67,300 announced square feet.
We’re looking forward to watching this one change over time. It gives us a good look at how far into their buildout phase these companies are. Interestingly, it doesn’t seem to matter all on its own. Different sizes are all over the map.
Here’s where the rubber hits the road:
The companies that have different valuations but similar footprints are either mis-priced or – kind of like DOJA Hiku – there’s a good reason for the value disparity. Coming up: the EG research department is going to show our readers how we find out which are which.
UPDATE: We’ve added a live version of the pre-cult bubble scatter chart below. The companies may change as they are bumped up into Cultivator status, or we move them out of our coverage universe for lack of data. Please send all complaints and hate mail to chris@equity.guru.


And Cronos fits where?
Hi, Michael. Thanks for reading.
Cronos reports 42,500 active square feet, and 401,500 square feet of total buildout. We appreciate their plain disclosure which doesn’t make us hunt for it.
The complication with working Cronos into something like this is that their enterprise value gets a lift from their investments. Chronos has some Abcann, Poth, Canopy, and Whistler Medical (private), plus some Israeli agricultural company. The pubcos are $4M in book value (as of Sept 2017), but that’s going to fluctuate with the market and with their trading. (Notably, Cronos has more earnings than anyone except Aphria, and it’s about half revenue from trading gains in most quarters.) Whistler is $4.8M, and since it’s private we can’t account for its actual market value. For all we know, it could IPO at a billion.
Cronos reports that they’re producing out of those 42,500 active sq ft, but not how much volume.
Right now, Cronos isn’t in our model, but we’re aware of it and will likely fit it in eventually. At such a time that they report 12 months worth of volume, they’ll definitely be tracked as part of our cultivator class.
Good read. Thanks for the clarity.