One of those rare weeks where the US Stock Markets, and world Stock Markets, have had multiple red candles to the downside. In an age where the investing strategy is “Buy The F’ing Dip” (BTFD), it has a lot of the retail crowd worried.
There is quite a lot to unpack before diving into the charts of the US Stock Markets. The Russell 2000 is the one I am concerned about the most.
The real stories of this week has to do with the commodity and the currency markets. Yes, there was some news regarding vaccine woes (Astrazeneca), Covid variants, but I think these are minor. As mainstream financial media has said: Stock Markets have pushed aside the pandemic, and are now worried about rising interest rates.
The Fed last week told us that interest rates are not going to be raised this year, but now the market is worried about potential hikes next year. To add fuel to the fire, Fed President Kaplan came out saying he expects an interest rate hike next year. So is the Stock Market happy that interest rates will not be raised this year? Or worried that interest rates will go up next year? This sums it up nicely:
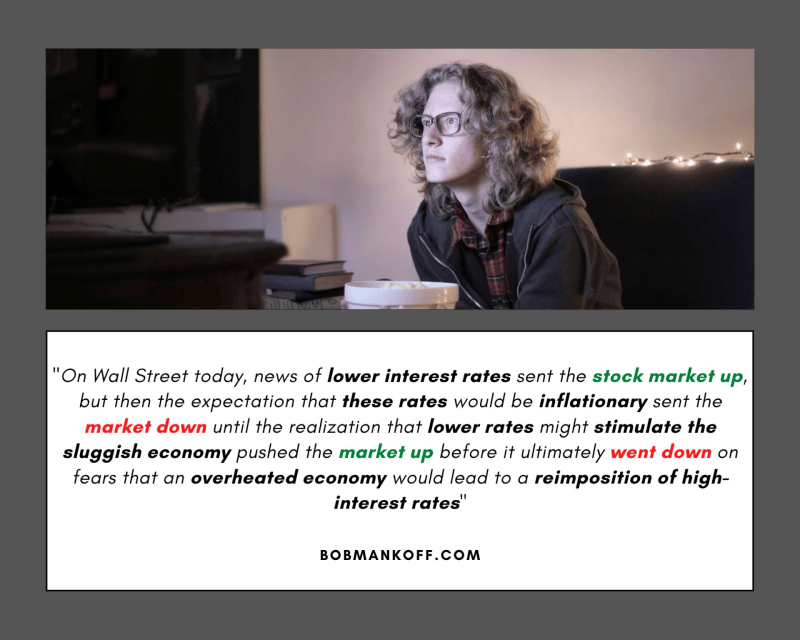
Another reason on why I prefer the technicals as they give us a much better indication of market sentiment. The Stock Markets display the human emotions of fear and greed. Both emotions can clearly be seen when looking at a stock chart and reading candlestick patterns.
Speaking about fear, I mentioned the commodity and the currency markets. Both are linked to this asset which has provided plenty of fear for traders and investors: the 10 year yield.
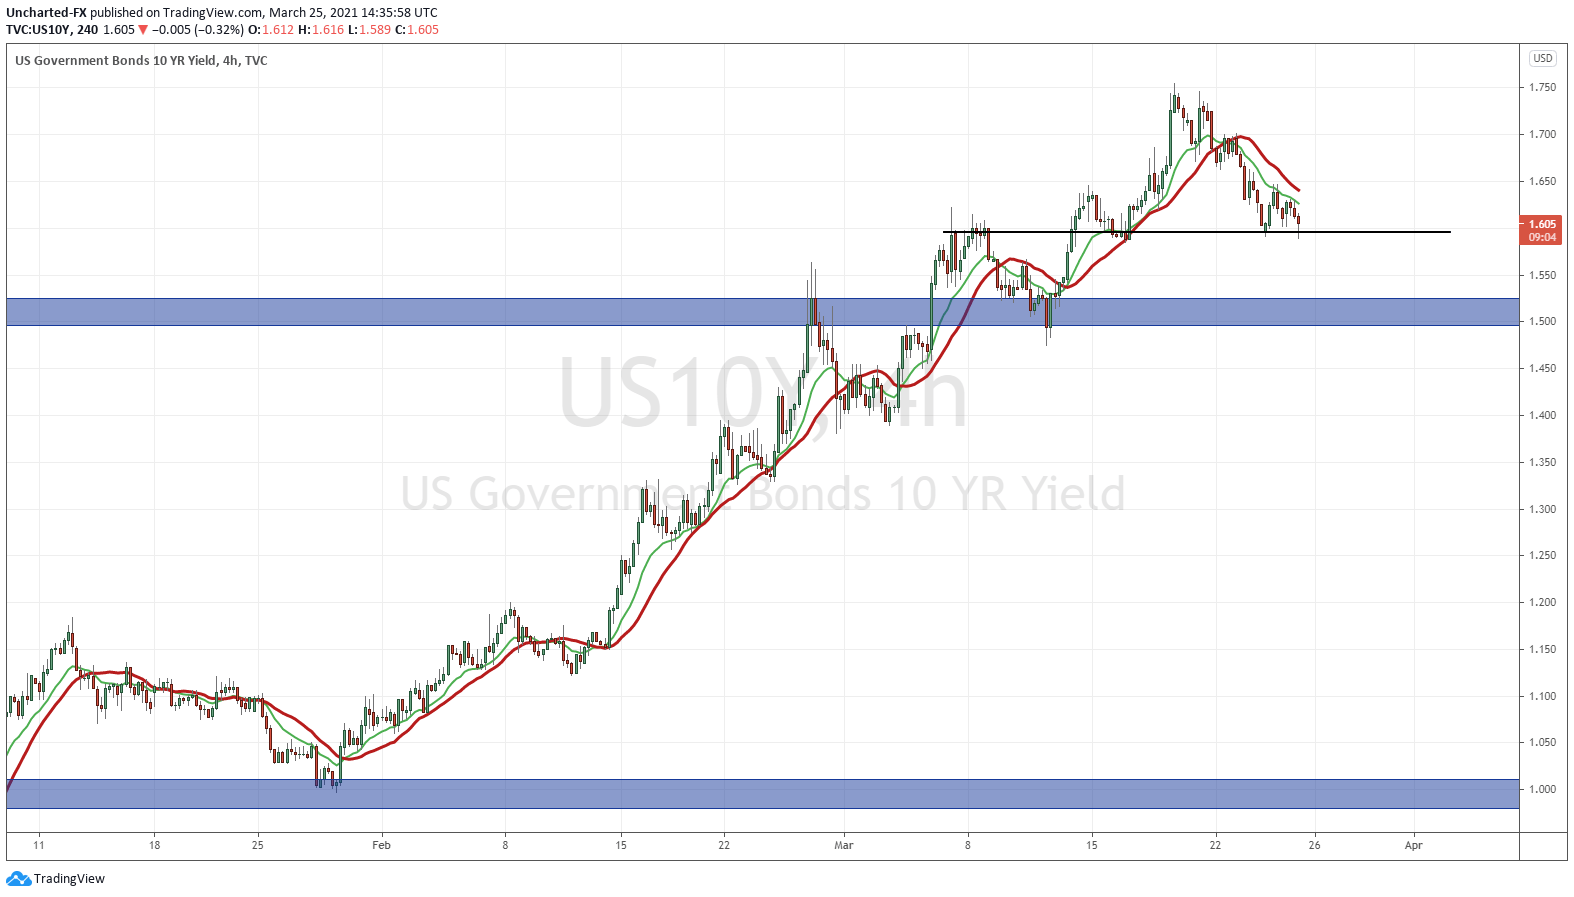
The 10 year yield remains above 1.50%, and at one point, was at 1.75%. The Markets wanted the Federal Reserve to reassure them that interest rates would be capped if they moved higher. As mentioned in previous posts, expectations for the Fed were high after the European Central Bank increased their asset purchasing program to buy more bonds to cap rising rates.
Sad I know. The Markets are begging for the Fed to manipulate bond markets in order to keep the party going. But this is the state of things.
What I want to point out is that rising yields were seen as negative for markets. With rates decreasing, why are stock markets still declining?
Remember when rates are declining, it means that money is heading into bonds (when bonds move up, rates decrease and vice versa). Bonds being bought up is a risk off move. Money is heading into the safety of bonds, and OUT of the stock market. This would be Stock Market negative obviously.
It looks like the 10 year yield will be heading lower, but this means that bonds are being bought. We are assuming this is traditional money flows leaving the stock market and heading for the safety of bonds. Fear. However, it very well could be the Fed. We do know that they are already spending 80 billon a month on purchasing US treasuries.
Rising rates lead us down the rabbit hole to currencies and commodities. Oil is the big story.
Suez Canal update pic.twitter.com/4L3vOs6HQ0
— Sven Henrich (@NorthmanTrader) March 25, 2021
The cargo ship which blocked the Suez Canal is affecting Oil prices. Now we are told that this cargo ship could take weeks to move.
Yesterday, I discussed how the real story about Oil is inflation. I put on my conspiracy cap to detail what Central Bankers are thinking. You can read it here.
Oil is the lifeblood of the economy, and affects both the energy and the financial sectors of the Stock Market. I still favor a move to the downside.
What may have gone under the radar are the volatile moves in the currency markets.
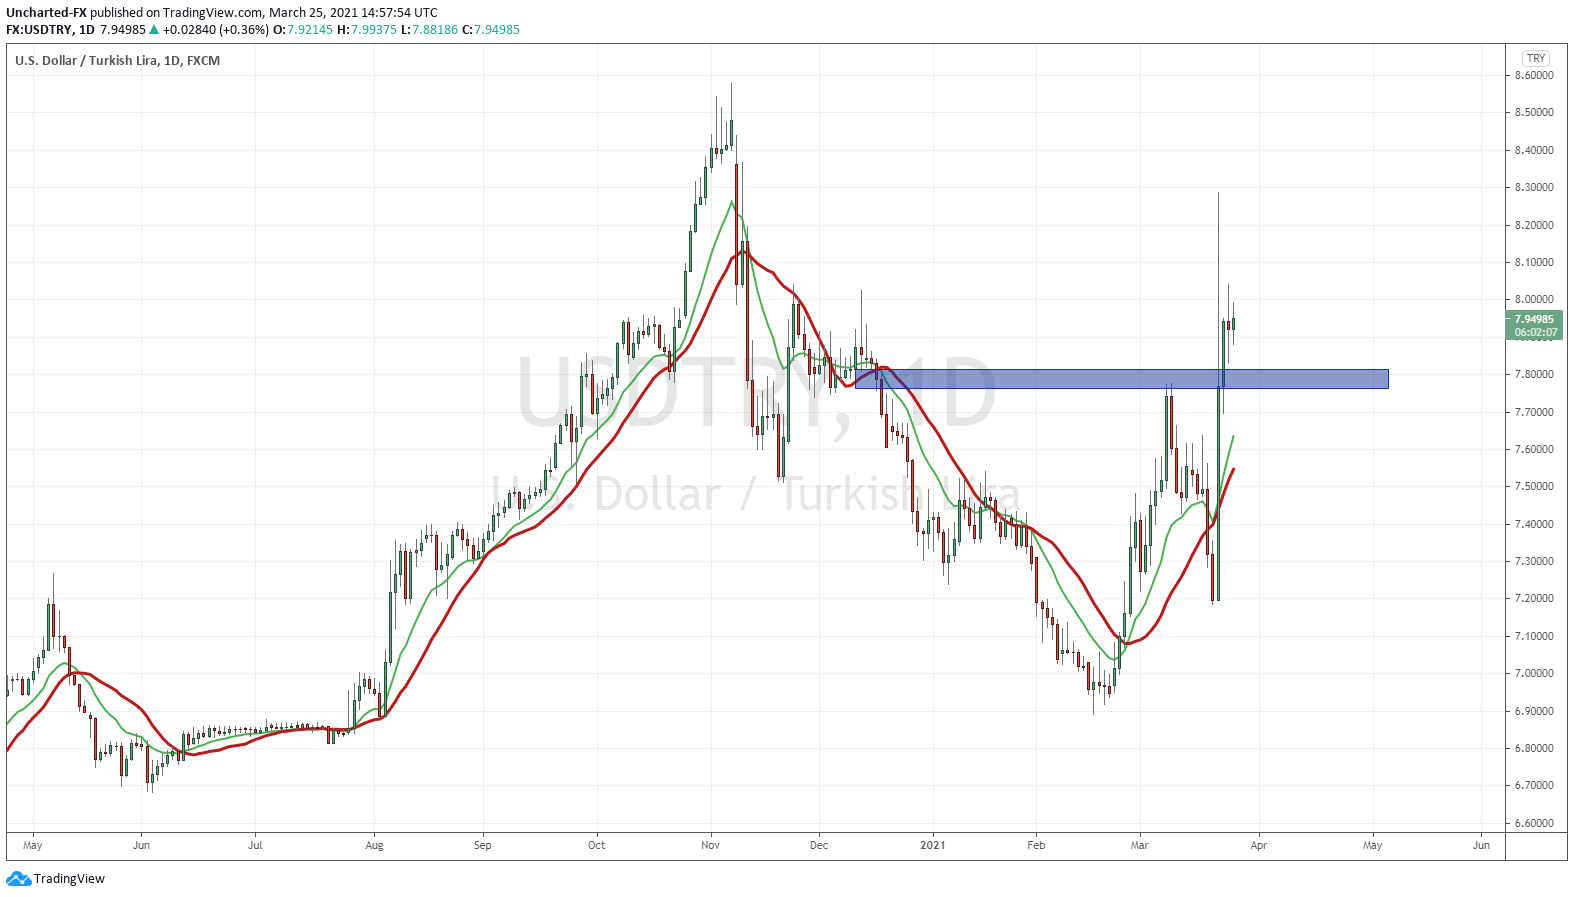
The Turkish Lira depreciated and made a 10% move in one day, as Erdogan fired his third central banker in two years.
This move weighing heavily on my mind because as long term readers know, I theorized that the US Dollar was purposely being weakened by the Fed in order to help Turkey. But that time might be up as the US Dollar continues its uptrend move.
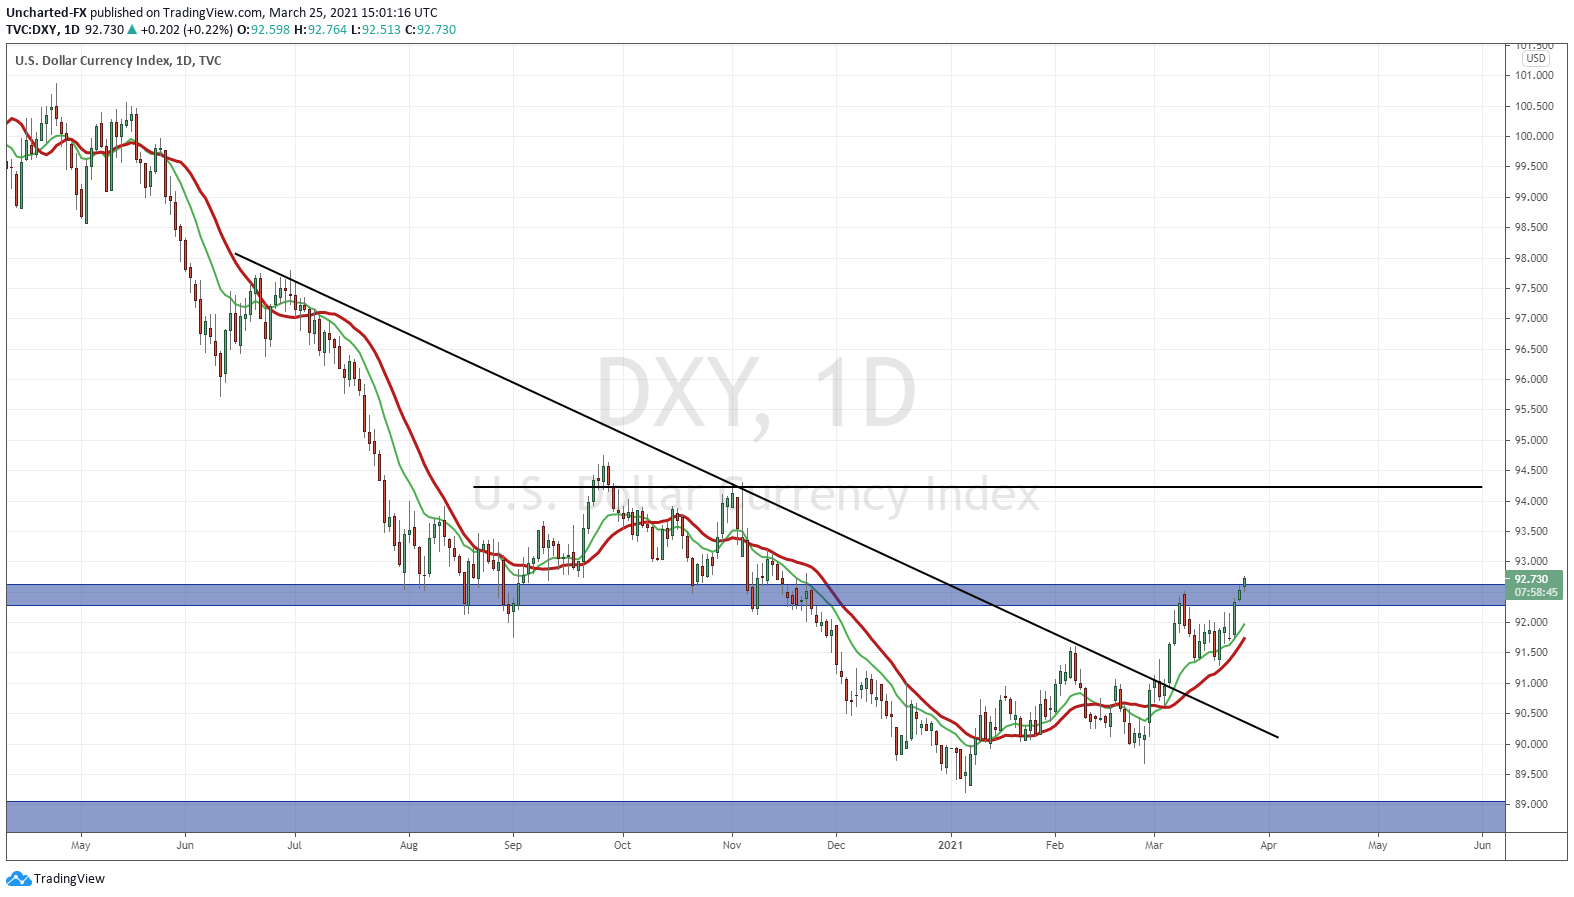
The US Dollar broke above our trendline, and we have had to wait weeks for the first higher low to be confirmed. The DXY can make a move to 94, as long as it holds above 92.40-92.50 zone.
The US Dollar is still the reserve currency and money flows regard it as the safe haven. This is the currency war that I have warned about. If all central banks are doing the same thing, what fiat would you rather hold? I think the reserve currency and safe haven wins out on this one. By the way, the Japanese Yen is up there as well in terms of s safe haven.
But here is where I smell trouble:
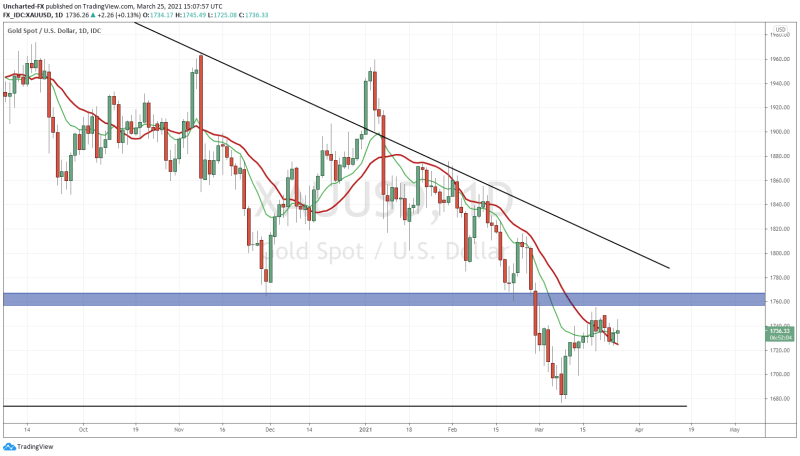
Gold has held up relatively well given the strong US Dollar move. Many see Gold as the anti-Dollar. That there is a negative correlation between the two.
I am here to tell you that YES! Both Gold and the US Dollar can move up TOGETHER. This happens when there is real fear and especially when there is a confidence crisis in government, central banks and the fiat currency. This is triggering the alarm bells in my head.
Technical Tactics
Knowing that the US Dollar move might be indicating some fear and trouble…and noting that Gold is holding up well indicating some more trouble, there is one market that warrants our attention.
The S&P 500, the Nasdaq, and the Dow are getting hit. But they still remain their important higher low zones. Technically they are still in a bull run above this, but this can also mean they will dump hard to retest those higher lows. I will be sure to cover it on Market Moment when this happens, but to stay up to date, I suggest joining us over on our free Discord Trading Room.
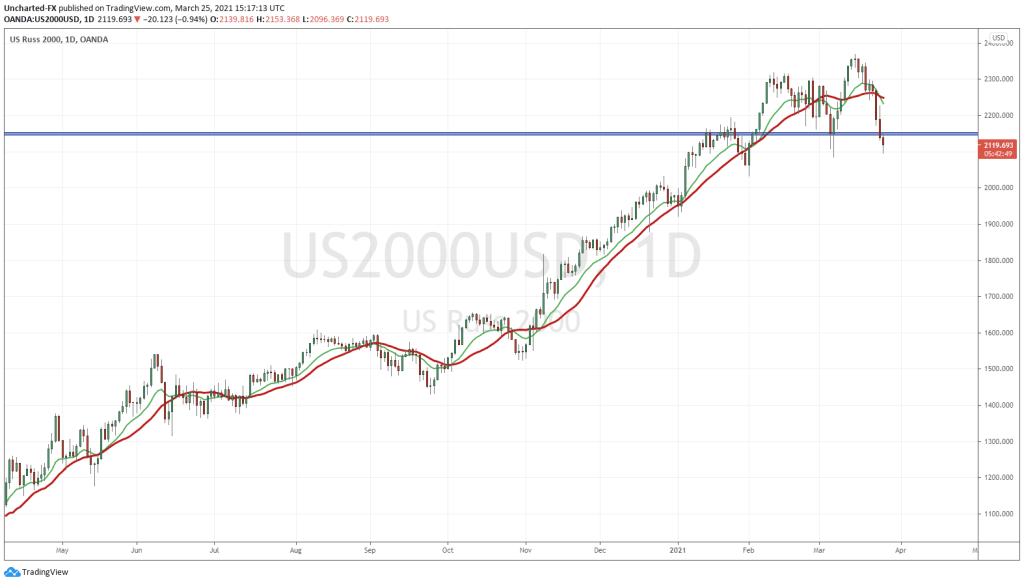
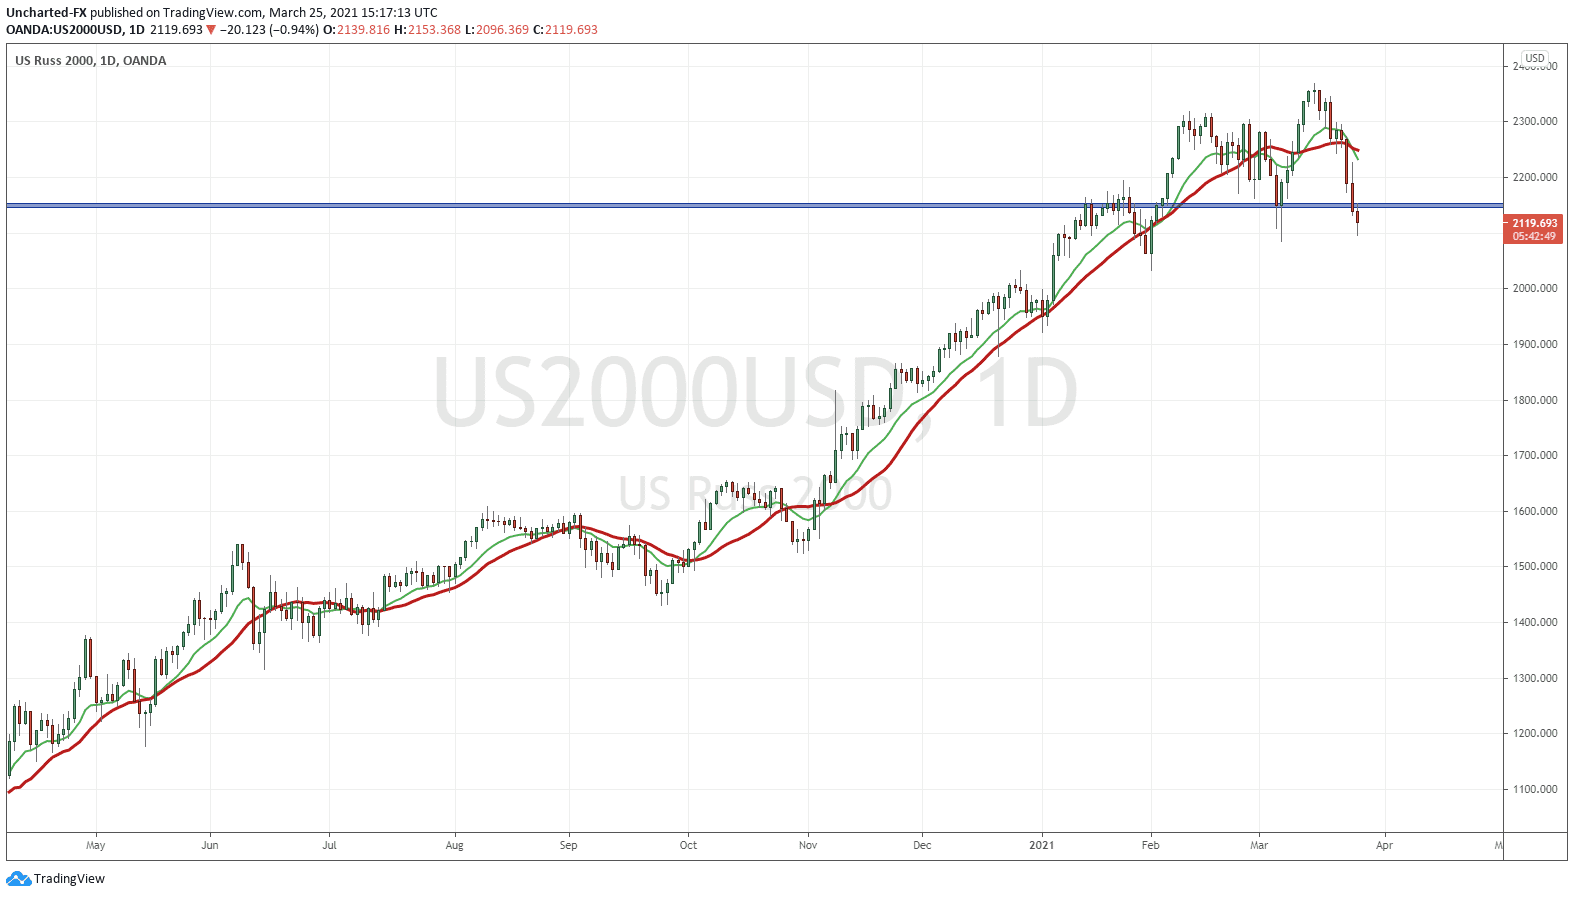
The Russell 2000 is the market to watch today and tomorrow. It is indicating the end of a US small caps bull run.
The 2150 zone is a major support zone on the Russell 2000, and also coincides with the most recent higher low.
Yesterday, we closed below this zone. This is worrying but this is where the argument about candle bodies and wicks comes into play.
The Russell 2000 closed below the candle body, but the wicks still provide support.
I admit that yes, the wicks can still indicate buyers stepping in so the Russell 2000 might still be saved. But I like to use an old trick to mark my major zones. Changing to a line chart.
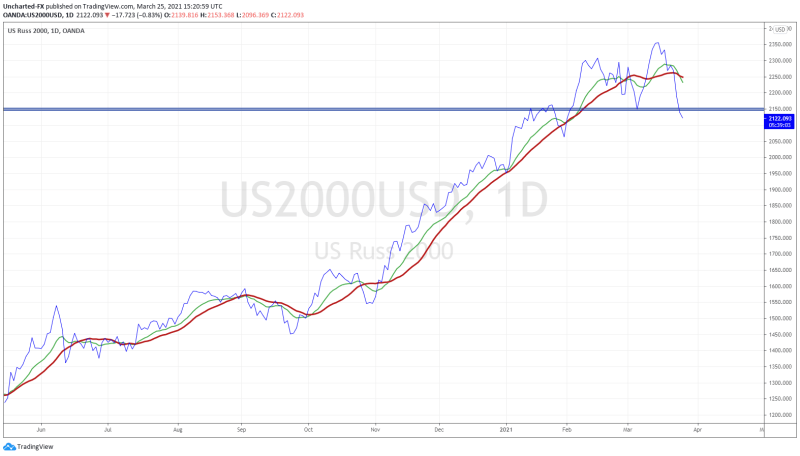
When we do this, you can see how major the 2150 zone is. And yes, we have broken below it.
What am I watching? Today’s daily close on the Russell 2000 is very important. For us to nullify this downtrend, we would need to print a close back above 2150. Not necessarily today, but whenever price pulls back to retest.
Other markets are under pressure, but the Russell is in danger of ending its bull run. On a technical basis, with yesterday’s close, the uptrend is over. Watch Oil and the Dollar. Both of which I have covered and forewarned about their moves.
The Dollar and Gold move indicates there is real fear. Be wary and stay safe.

