A post aimed at those of you who are new to the site and/or new to the market. May also prove interesting to existing market technicians. Enjoy.
In the markets there are two distinct camps of analysis: Fundamental Analysis (FA) and Technical Analysis (TA).
The former deals with news, information, stories, macro economics, balance sheets and the like while the latter is akin to reading tea leaves and constantly looking over your shoulder lest someone accuse you of being a witch and drag you to off the nearest stake.
I’m confused as to why so many market pundits feel that they have to pick a side – at times it feels like being at a Celtic vs Rangers football match.
While the two can work together, it’s natural as you further your market education to gravitate towards one approach. For me, TA is a more natural fit and I utilize it extensively.
Given that I’ve watched the entire series of ‘Buffy the Vampire Slayer‘, I’m comfortable being a technical analyst.
I believe that price is pure and that the Open, High, Low and Close of a security provides us with tremendous information.
As a market technician, my window to the financial world is the chart, and the purpose of this post is to help you to learn to read the story that the chart wants to tell. Then you will be in a stronger position when it comes to making investing (trading) decisions.
I’m highly skeptical when it comes to information. I should qualify that by saying the quality of information, because we live in a world where we are connected 24/7 to all types of information feeds and(ro)bots initiate trades based on nothing more than a scan of these sources. I mean, how crazy is it that stock prices can spike or dump based on a ‘tweet‘? (Manipulation, anyone?)
Generally speaking, it isn’t a level playing field. You need to be connected. Does the average person sitting at home in front of his PC have access to the same sort of information as someone sitting on the trading floor of a large institution? Of course not. I will concede that if more sites like this one spring up then maybe the little guy has half a chance.
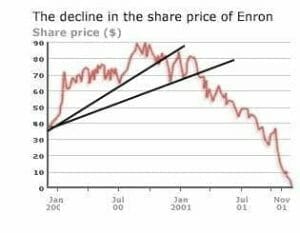
Can CEO’s lie about the true financial position of their companies? Of course they can! (Enron, anyone?).
During the GFC all the big players on Wall Street were disguising derivative liabilities in ‘off balance sheet’ items in an attempt to portray a healthier financial position than was the case. As we all know, the chickens eventually came home to roost.
I’ll listen to any story that you want to tell me, but when it comes to putting down cold, hard cash I’ll take my chances with the charts, thanks.
Having been a student of TA for 20 years now, he’s what I’ve learned:
Keep it simple and be consistent
The four main tools on my TA tool belt are:
- Trend Lines
- Bollinger Bands
- RSI (Relative Strength Index)
- Moving Averages
Trend Lines
Trend lines still work, in fact they are the number one weapon in my technical arsenal.
Usage: Draw a line connecting the lows (for an uptrend) or highs (downtrend). When price closes below (above) the trend line it acts as a warning that the trend may be weakening. The amber light, if you will. Note that price action tends to move sideways after a TL break before breaking down.
TLs would have proved useful had you been long Enron stock in late 2000/ early 2001. By the time it hit 60 bucks on the way back down, it was obvious there were problems, despite what all the talking heads were saying.
Bollinger Bands
Bollinger bands, named after their creator John Bollinger, are useful because they allow us to visualize volatility. I like the stock standard (20,2) setting which is a 2 standard deviation envelope around a 20 day moving average. This gives us three ‘bands’ – the upper, middle and lower.
Usage: Note that price action is generally contained between the middle and upper bands for an uptrend and the middle and lower bands for a downtrend.
Hence the middle band often acts as support (uptrend) or resistance (downtrend). When price action shifts from one zone to another it often signals a change in trend.
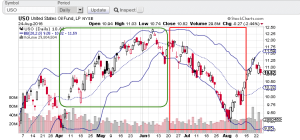
USO (an ETF which tracks the price of Crude Oil) has been a textbook example over the past few months. (Crude has generally trended particularly well over the past few years.) We can see both a long and short trade that would have been pretty easy to nail down based on using the BBs. The green rectangle shows a nice uptrend before a reversal and then an equally juicy down-trend beginning in late June.
RSI
Relative Strength Index was developed by noted technical analyst Welles Wilder, and is used to identify price ‘extremes’ – both to the upside and downside.
A 14 period RSI is useful to get a handle on greed and fear (I’m not fond of the terms ‘overbought’ and ‘oversold’ which are often used wrt RSI).
Usage: If the RSI is 70 or above I would hold off on initiating a long position – effectively I’m too late to the party – I’d much prefer to wait for a better entry spot. Alternatively, an RSI reading of 30 or below suggests that a buying opportunity may be close at hand as market players start to throw in the towel.
NB: During a strong uptrend elevated RSI readings of >= 70 are not uncommon for extended periods. For that reason I do not advocate initiating short positions based on a high RSI alone, rather suggesting it signals a good point to ‘take some off the table’ or exit the position if this is in line with other criteria in your trading plan.
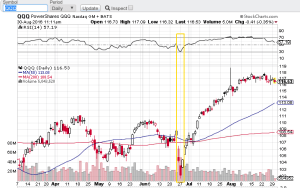
QQQ (‘Cubes’ – NQ tracking ETF). The RSI touch at 30 nails the bottom of the move. Even if you got in @ $105 you made some nice coin by just sitting tight while the market rebounded.
Moving Averages
Daily moving averages (dma) are used widely by a number of market participants. The only two that I suggest you concern yourself with are the 50 and 200.
The 50dma and 200dma are important simply because a lot of people look at them. (more so with stocks). Hence crowd mentality can kick in at these levels. Also, when these levels fail to hold, that is tremendous information that Mr Market is sharing.
Usage: Be aware of these price levels, and where your stock is in relation to them.
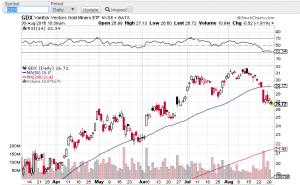
GDX (Gold Miners ETF) – After providing good support in late May / early June, the stock has recently fallen below this level decisively. The MA will now likely provide ‘resistance’ from the underside. This is one of those charts where the information leaps of the page when you know how to read it – there is no good reason to be long GDX anymore. (at least in the short-term)
Use a ‘weight of evidence’ approach
When deciding on a trade, don’t look at a single piece of data in isolation.
1) Try and look at the same price action through a different lens. Let’s say someone tells me a story about the Aussie dollar (AUD). Maybe a taxi driver with a hot tip or the local shoe-shine boy. As soon as I have access to a PC, I’ll want to look at the AUD futures chart first and then FXA (Australian Dollar ETF). Probably also have a butchers at the spot AUD/USD FX chart. Are they telling the same story?
2) Look at other asset classes and indexes for confirmation. It’s not smart to short AAPL when the NQ is in a raging uptrend. After studying the markets for a while you get a feel for what asset classes move in tandem (hence they are correlated).
That’s it ! I suggest you don’t overlay your charts with a whole bunch of indicators and oscillators. They are all derivatives of price and will lag to some degree. Remember the KISS principle. Less is more.
Portfolio Update
A while back I pitted my theory of holding fewer positions to outperform the market and so far things are progressing nicely.
Boy did we dodge a bullet on GDX. Luckily we weren’t on the bus as it went over the cliff recently. He’s how it played out:
The ‘Five Arrows Trust’ bought 200 shares of GDX and sold the Aug 19 $29 call option for $2.75, which expired ‘in the money’ (GDX closed at $29.96 on expiry day). As any ITM options are automatically exercised, our shares would have been ‘called away’ with us being payed 29 bucks a piece for them. While we lost a nickel on our purchase price, we keep the 2.75 option premium hence our profit is $540 before brokerage.
This leaves us sitting with a nice stack of cash while we scope out our next trade.
Our only open position is C.LAG (Laguna Blends). LAG is proving a little frustrating. We bought in @ 0.19 and they last traded 0.25. We’re in profit ($750), and trying to let those profits run but the stock ran out of steam when it tried to clear 0.30.
I have to say, the chart which was promising a few weeks back is now looking a little ominous.
I’m setting a hard SL (stop loss) on this puppy of 0.22. If it reaches this level again I’m out, no questions asked and will move on to the next trade. Maybe I need to peek at the earnings calendar to see when they next report. Another factor at play is that storm clouds are gathering, and the market is entering what is often a particularly tricky part of the year (September/October).
‘The Turtle’ is plodding along but we are comfortably ahead, even at this early stage.
‘The Turtle’ Portfolio value: $10,352.56 +$352.56 +3.52%
‘5 Arrows’ Portfolio value: $11,280.00 +$1,128.00 +12.8%
I have to say, 3.5% is not too shabby. 12% is nicer. Much nicer.
If you have any questions about TA, ask in the comments section and I will gladly answer as best I can.
–// Craig Amos
Charts: stockcharts.com



Private Placements
Excellent primer for new investors…..Side bar question. Chris Parry eluded to anyone beimg able to invest in a private placement. The mention of accredited investor comes up often which these days seems very open to interpretation. The net worth component of accredited investor may beyond the scope of some new investors. Are there any ways to still invest in a private placement and not have to uphold the net worth requirements set forth by definition? The new paradigm of investing ie crowd sourcing etc, does it carry any weight if people wanted to form partnerships among themselves to help reach the threshold of accredited investor. Many opportunities exist for private placements but it seems the high net worth criteria excludes many who could contribute smaller sums but en masse still making a difference.
Good question.
I can only answer based on my knowledge how it play out in Australia, where the term used is “sophisticated” investor.
Unfortunately, these issues/placements tend to be out of reach unless you are connected. (Even if you are a high net worth individual). They are gobbled up quickly by institutional demand – look at it from the other side of the table. If I’m handling the placement and it’s on favorable terms, I’m likely to reward my best customers and give them the first bite of the cherry.
It’s not a level playing field and probably never will be IMO.
I’ll ask Chris to throw his $0.02 in on the topic.
Yeah, it’s very much still a case of, who you know.
But the rules (in Canada) have changed a little recently. Anyone can invest in a private placement, as long as you do so through a broker. Now, those brokers tend to have less time to deal with folks who are buying in hundred dollar increments rather than $50k increments, because they clear 7% as a finder’s fee on the other end, and if you go straight to a CEO, they too have limited time to play with the paperwork of a bit player.
BUT.. this is evolving. Stockhouse’s Deal Room recently featured a raise for a company called Shoal Games, which bothered to put its deal together in a way that actually allowed small investors (outside of Ontario which, for some reason, doesn’t allow such things still). Not sure how well that went, but it was the first raise in which that new rule was invoked.
Just quietly, a lot of CEOs will help you through this process through the myriad loopholes that exist in the rules. If you’re an existing investor, as an example, the PPs are open to you. If you’re friends or family with someone in the deal, likewise.
Bottom line: The rules are a mess, but they’re changing quicker than the people in the industry are seemingly capable of keeping up with.
If you have a particular company you’d like to get in on, let me know (chris at equity dot guru) and I’ll see if I can’t find someone to call you back.