In July 2023, I gave a price target of $65 on spot uranium by the year end. The reason I chose $65 was because this was the 2022 highs and thus, the next major resistance zone for spot uranium. This was the chart I displayed back then:
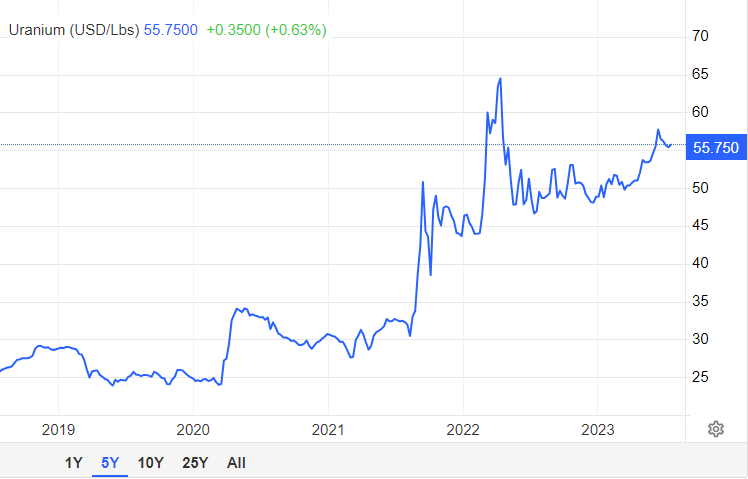
Uranium bulls did not have to wait until year end for this target to be hit and surpassed. The energy sector is on fire. There is a lot of talk about oil as it continues to rise and increase inflationary pressures. By the way, our oil targets have also been hit and surpassed. For more info on energy, check out my most recent oil piece. Uranium is included in the energy space, and it has also been on a tear. Although many would attribute this rise to simpler fundamental reasons.
Let’s take a look at the fundamentals before looking at a bunch of charts.
The reason why there are many uranium bulls is because the story is simple and makes sense. If the world wants to combat the climate crisis by lowering carbon emissions and having an energy source that is reliable and can handle base load power, then nuclear energy is THE choice. World governments agree and many nations continue to announce plans to increase nuclear power capacity to strengthen energy security and lower emissions.
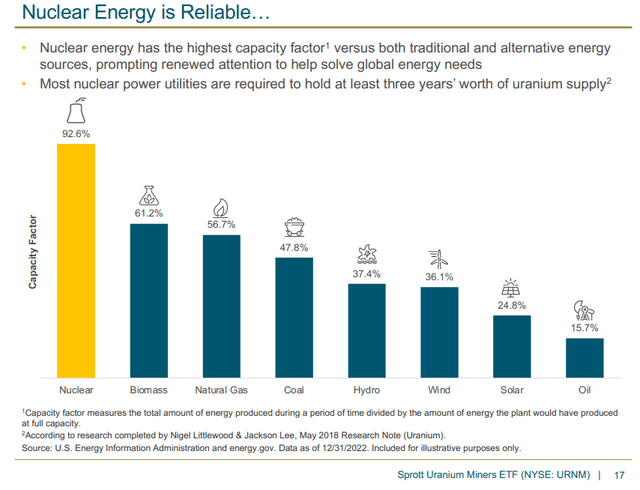
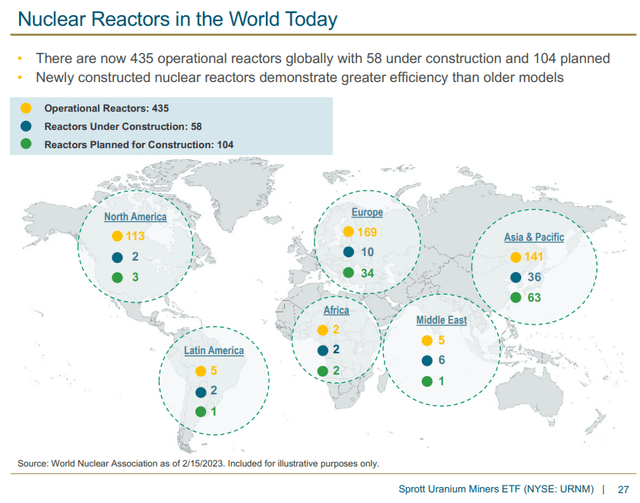
With new reactors being built and nuclear capacity increasing, there will be a strong demand for uranium for years and likely decades, to come. But let’s not forget about the supply side of this equation.
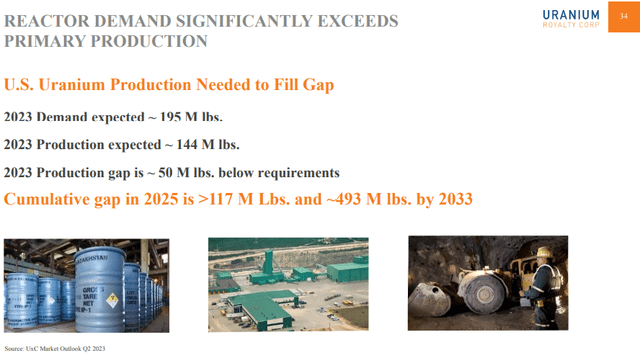
As you can see, supply comes in short. Let’s put it together with the most basic economics equation: high and growing demand which exceeds production and supply means higher uranium prices.
The uranium market is on fire because of this simple market condition. And uranium bulls continue to be excited given this strong fundamental backing. However, there are also other geopolitical factors which are playing a role in the rising price in uranium. Tradingeconomics summarizes the uranium fundamentals nicely:
Uranium soared to $70 per pound in September, the highest since touching the pre-Fukushima disaster of $73 in 2011 as strong demand from utilities worldwide coincided with low inventories and threats to supply. Volatile fossil fuel prices, uncertain oil supply, and decarbonization objectives from the world’s largest economies continued to drive governments to invest in nuclear power production. China is expected to build another 32 nuclear reactors by the end of the decade and Japan allowed plans to restart multiple plants and build new facilities, aligned with the World Nuclear Association’s upward revision for global nuclear power production. The developments coincide with renewed concerns about supply with Canada’s Cameco, the world’s second-largest uranium miner, reducing its production guidance for the current year. Political turmoil in Niger also drove Orano to suspend operations in the country, while Western utilities continued to shun Russian nuclear fuel.
Charts
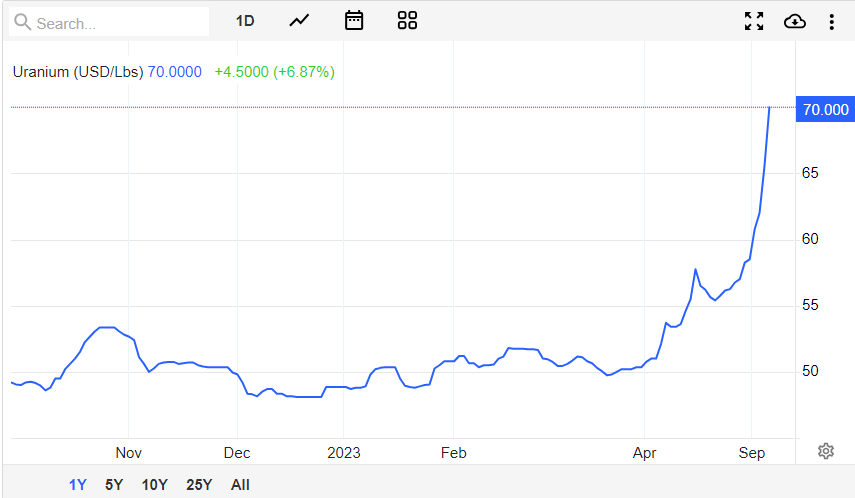
The move in uranium these past few months can only be described using one word: explosive. Parabolic.
As you can see spot uranium briefly pulled back to retest the $55 zone before exploding higher. Going forward, this is the higher low we are working with. This means that as long as spot uranium remains above this price level, the uptrend remains intact and any moves lower would just be a corrective move in the current uptrend.
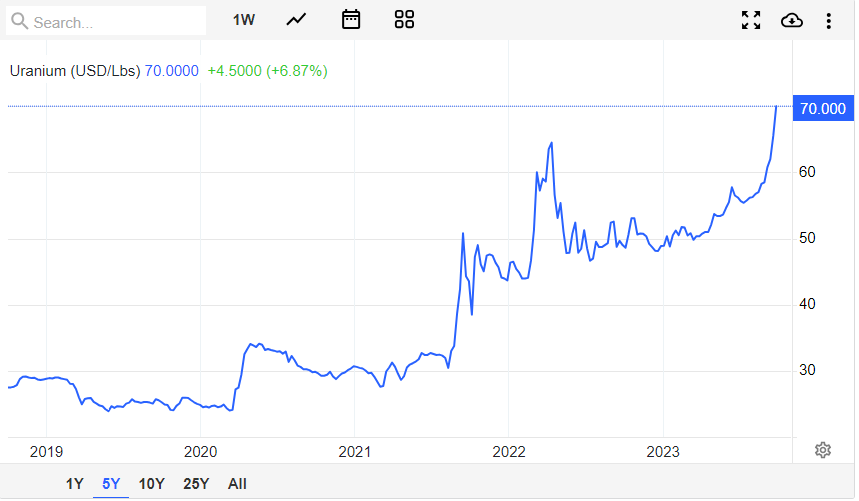
The longer term chart here shows that spot uranium has taken out the 2022 highs of $65. The basic breakout and retest technical analysis still applies. When a breakout occurs, price tends to eventually pullback to retest the breakout zone before continuing the move higher. This means that a move back to retest $65 is possible. This corrective retest could be deeper but remember, it is corrective as long as we remain above $55.
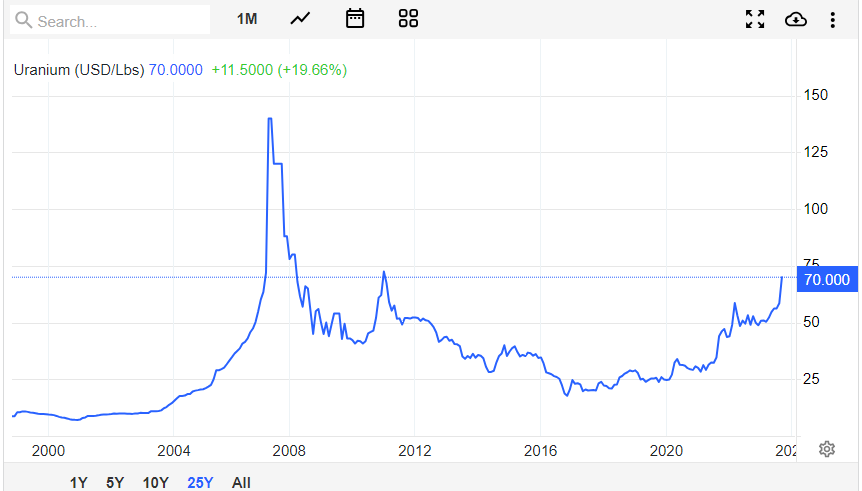
So where to next? The next resistance zone comes in at the $75 zone. If spot uranium can break this then there is a lot of room to the upside. I would watch $100 given it is a psychological number. And then we would be targeting the highs around $141. But these are medium term to longer term targets.
The takeaway is that uranium is in a bull market and major resistance zones have been taken out. The uptrend remains intact as long as the current higher low is held.
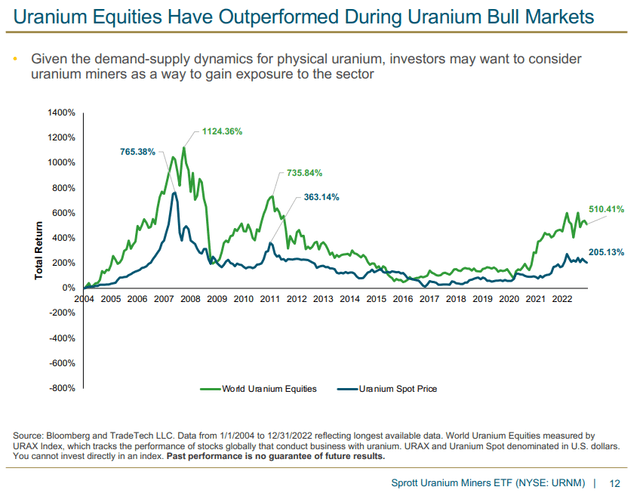
With a uranium bull market in play, the investor should look for returns in uranium equities which have outperformed during uranium bull markets.
Let’s begin with some ETFs.

The Global X Uranium ETF has also broken key levels. The market structure is similar to spot uranium. URA broke above and retested the major resistance zone at $24, and has shot higher since then. We are now testing a key resistance zone around the $28.50 zone. Similar to spot uranium, URA could pullback before continuing the uptrend. In URA’s case, the higher low comes in at $25.75.

If you prefer an ETF which tracks the spot price of uranium then look no further than the Sprott Physical Uranium Trust. The market structure is similar to spot uranium and a major breakout has occurred. If we see a correction in spot uranium, then U.UN will follow.

Canada’s largest producer, Cameco Corp, has also been on fire. I had to zoom out to the monthly chart in order to be able to show the next resistance target! As you can see, it will be previous all time highs at around the $60 zone. Support comes in at $43.
What about if you want to play some stocks with a higher return? Uranium juniors are worth looking at but remember, the higher return comes with higher risk!

Standard Uranium (STND.V) is a junior uranium explorer operating in the Athabasca basin in Saskatchewan, Canada. The Company holds interest in over 176,969 acres (71,617 hectares) there.
There has been a recent turnaround in the stock and the story of a remarkable comeback.
The stock broke above the major resistance zone around $0.03 which I told readers would be the bullish trigger. The stock then pulled back to retest the $0.03 zone which saw new buyers step in. This is just a typical and expected breakout and continuation of the market structure. The rising prices in the energy sector, including spot uranium, is playing a big role in this reversal. From the retest to recent highs of $0.09, the stock has ripped over 155% in less than two weeks!
Standard Uranium stock has also closed above the first resistance level at $0.06. As long as the stock remains above this price zone, the uptrend can continue. Recent price action is showing a range and it appears the stock could be stalling on momentum. A pullback and retest to the $0.06 zone is possible. If the uptrend continues, the next resistance zone comes in at $0.10.

Skyharbour Resources (TSX-V: SYH), a uranium exploration company with prime assets in the Athabasca Basin, is poised to capitalize on the anticipated resurgence in the uranium market. The company’s extensive portfolio of uranium exploration projects and strategic joint ventures with industry leaders make it a wise investment for those seeking to benefit from the rising demand for nuclear power. With twenty-four projects covering over 504,000 hectares of mineral claims, Skyharbour is well-positioned to become a major player in the uranium mining industry.
The stock is at a very important resistance zone. It is testing the major resistance zone of $0.55-$0.57. If Skyharbour continues its momentum, then this zone will break and lead to a run up to the $0.78 zone. This is definitely a stock with good looking technicals. Support and the current higher low comes in at $0.425.

Azincourt Energy (AAZ.V) is a Canadian-based resource exploration and development company focused on the alternative fuels/alternative energy sector. Their core projects are in the clean energy space, with uranium exploration projects in the prolific Athabasca Basin, Saskatchewan, Canada, and lithium/uranium projects on the Picotani Plateau, Peru.
In my previous technical analysis rundown on Azincourt Energy, I mentioned the stock was ranging after printing new all time record lows at $0.03. I pegged the $0.045 zone as the resistance level the stock would have to break in order for the bulls to begin to build reversal momentum.
In the past few days, Azincourt Energy has taken out this resistance. Subsequent days show interesting price action on the retest. Buyers are stepping in to defend this zone as is evident by the major green candle printed on September 20th 2023. If the stock takes out recent highs at $0.05, the new uptrend will continue with the next major resistance coming in around $0.08.

