Skyharbour Resources (SYH.V) is showing a very promising technical pattern that uranium bulls should take note of. But before we look at the chart, let’s take a brief look at the company and its recent news.
Skyharbour is a $63 million market cap company that controls 15 uranium and thorium exploration projects in Canada’s famed Athabasca Basin. Ten of the projects are drill-ready, covering over 450,000 hectares of land.

Skyharbour has acquired from Denison Mines, a large strategic shareholder of the Company, a 100% interest in the Moore Uranium Project which is located 15 kilometres east of Denison’s Wheeler River project and 39 kilometres south of Cameco’s McArthur River uranium mine. Moore is an advanced-stage uranium exploration property with high-grade uranium mineralization at the Maverick Zone including highlight drill results of 6.0% U3O8 over 5.9 metres including 20.8% U3O8 over 1.5 metres at a vertical depth of 265 metres.
Adjacent to the Moore Uranium Project is Skyharbour’s recently optioned Russell Lake Uranium Project from Rio Tinto, which hosts historical high-grade drill intercepts over a large property area with robust exploration upside potential.
An inaugural winter drill program at Russell Lake is underway, and the fully funded 10,000 metre drill campaign will provide catalysts and news flow for Skyharbour.
Skyharbour’s partner, Azincourt Energy (AAZ.V) has commenced drilling at the East Preston Project. After some initial startup delays due to extreme weather variations, two drill rigs are now operational on the project. Six drill holes are complete and two are in progress.

I recently spoke about the current uranium market setup last week. Uranium squeaked a gain in the month of February 2023, and was one of the only commodities to do so. I am still optimistic of the current uranium setup, but don’t let the current URA green day fool you. We must see how the candle closes. As long as the daily candle remains below $21.75, the downtrend remains intact and another leg lower is probable. A strong close above $21.75 would get the uranium sector excited and popping again.

Skyharbour kicked off the year strong with the stock moving over 40% from the first trading day of the year to the highs printed at $0.52 on February 2nd 2023. Much of those gains have been given up given the hit commodities took in February.
Yet, the stock remains above a major support zone at the $0.40 zone. As long as it does, another swing higher is possible.
Currently, we are seeing the stock consolidate between two trendlines. We have 3 or more touches on both which is what validates these lines as significant technical levels. A wedge has formed and the stock awaits a breakout in either direction.
Bulls want to see this:
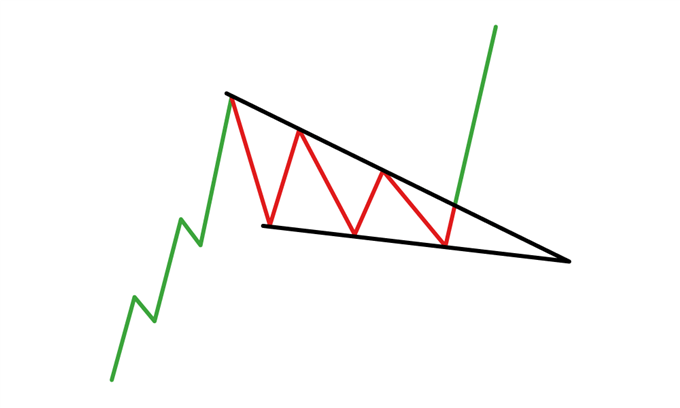
Above is the bullish falling wedge. A pattern which appears after an uptrend and then sees price consolidate. Just like we are seeing with Skyharbour Resources.
The break is needed and the stock is currently contained above support and between this wedge. If we see URA breakout from its resistance zone, this would help drive Skyharbour higher. Momentum which then can be sustained with drilling catalysts going forward.
To the upside, I would watch the $0.50 zone which is a major psychological zone AND is the recent 2023 highs for the stock. If we can get a daily close above this, then the $0.60 resistance zone comes next.