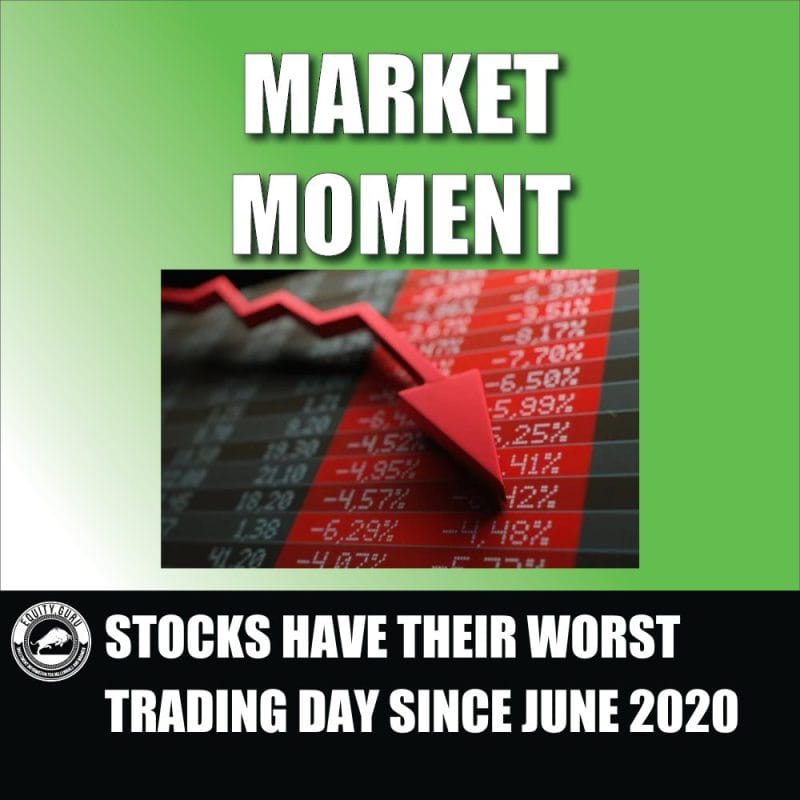
One day. One day is all it took for the US stock markets to erase four green days of price action. Gains gone. This is what happens in a bear, or downtrend market. Instead of buying the dips, you sell the rips when they hit or approach major resistance levels.
And sometimes it takes a fundamental catalyst to get things going. August CPI came in hot. Inflation is still here and the markets now believe the Fed will continue to be aggressive in raising interest rates. It is almost a funny thing considering the Fed and Fed officials have been adamant about raising interest rates until inflation falls back to their 2% level. We still have ways to go.
The markets were pricing in a tame inflation report. A report which would indicate inflation turning down and hence, a more pragmatic approach from the Fed. The markets had it wrong and the evidence is yesterday’s reaction.
US stock markets had their worst day since 2020. Since June 2020 to be exact.
The Dow sank more than 1,200 points Tuesday, or nearly 4%, while the S&P 500 lost 4.3%. The Nasdaq Composite dropped 5.2%. It was the biggest one-day slide for all three averages since June 2020.
“Tuesday’s selloff is a reminder that a sustained rally is likely to require clear evidence that inflation is on a downward trend. With macroeconomic and policy uncertainty elevated, we expect markets to remain volatile in the months ahead,” Mark Haefele, CIO of UBS Global Wealth Management, said in a note to clients.
In previous articles, I have warned investors and traders that the markets are shifting from the inflation narrative to the recession narrative prematurely. Food and shelter prices continue to rise and remain elevated. Gasoline prices, which have fallen and why many believed inflation would come out less, could soon be rising as OPEC+ is beginning a production cut of 1 million barrels starting in October. Of course the effects will be determined by the demand aspect. If the economy is slowing down then there is less demand and the production cut (more supply) just keeps the markets at an equilibrium. If not, well we should expect oil to rise… and me being a technical chart guy, there is a potential for an oil reversal.

Stocks are little changed as they attempt to recover after the worst trading day in two years. We could see some choppy markets heading into the next major event risk. I am referring to next week’s FOMC interest rate decision. On September 21st 2022, the Federal Reserve is expected to raise interest rates by 0.75%. That is already priced in the markets. What will make markets move will be the Jerome Powell press conference. If Powell remains hawkish and hints at larger interest rate hikes, the markets will surely react.
We have also told readers that the two charts you must watch if you want to know where markets are heading are the 10 year yield and the US Dollar.

The 10 year yield is knocking on resistance at 3.50%. There is a good chance we see the 10 year yield retreat from here in the days leading up to the big FOMC day next week. If so, markets can recover but at that point, it is likely just a brief pullback. If the 10 year yield takes out 3.50% post the Fed, we would be seeing levels on the 10 year which we haven’t seen since 2011. Markets would head lower.

The dollar is what we have been using to gauge fear and uncertainty. Yes, cash is a position when things are wild, but let’s not forget the US dollar is the reserve currency and hence a safe haven asset. A stronger dollar is something to pay attention to. We have seen the absolute cratering of the Japanese Yen, but other currencies are feeling the pressure including the Euro and the British Pound. As the dollar gets stronger, it has the potential to wreak havoc.

What about the VIX? The so-called fear index. In actual fact, the VIX displays volatility in the market, not necessarily fear. As a market structure guy, the VIX set up to me shouts “more volatility ahead!”. The question is when. A good candidate is the Fed day next week, which may mean a bit of market relief and range until then.

Finally, looking at the S&P 500 (other US market indices look the same!) We look to be continuing the lower highs or downtrend which began after rejecting the 4300 zone. Note how yesterday’s sell off also occurred just a day after we closed above the moving average. That break turned out to be a false breakout which just adds to the bearish sentiment.
Going forward, if we see a daily close below 3900, expect the S&P 500 to retest June lows and likely break below into new recent lows. I am looking at 3500 and lower. To turn bullish, I first want to see the S&P 500 close above 4200 as this is the current lower high in this downtrend. Breaking above 4350 is also crucial in order to sustain upside momentum but that is a story which we will discuss if we get there.
In summary, the markets are shifting back to the inflation narrative and the Federal Reserve is likely to remain hawkish and aggressive in their rate hikes. Next week will be an important week for markets which may see us on the path towards new lows for the year.

