

It was just a few weeks ago where I called the reversal in Bitcoin and other cryptos. Here is a video of me explaining the bottoming pattern and the breakouts on bitcoin and ethereum:
Since that call, bitcoin has risen close to 20%, while ethereum has risen over 60%! The patterns that I look for triggered on both, but ethereum looked much nicer. All we do is put the trade on and then repeat looking for the same technicals. It never fails.
After a month from that reversal trigger call, why am I calling now for a sudden plunge?
As regular readers know, I have been saying that cryptos move as a risk on asset. Simply meaning that bitcoin and other cryptocurrencies move in tandem with stocks. If there is a major sell off in stocks, bitcoin and the other cryptos will also fall.
Currently, the stock markets are looking very bullish after closing above a major weekly level. Some are calling this the most hated rally over. However, my eyes are still on that 10 year yield chart which is beginning to pop today at the time of writing. If it continues higher, this will put pressure on stocks and therefore cryptos as well. The US Dollar (DXY) is another chart showing signs of a breakout. This would weigh in on cryptos and precious metals.
But the main reason I am expecting a major dump on bitcoin is because of the technicals.

Bitcoin has recovered nicely since it held major support around $20,000 and broke out of a range. That breakout was our reversal trigger. A few higher lows later, and bitcoin is now finding some resistance around $25,000.
When it comes to breakouts and reversals, I like my trades to have nice momentum. We haven’t really seen that with bitcoin. The upwards move has been slow and mute. Breakouts don’t see a rally but instead a drop and a few days of pause before slowly inching higher. It has not been a strong rally.
Now I want to show you this technical pattern:
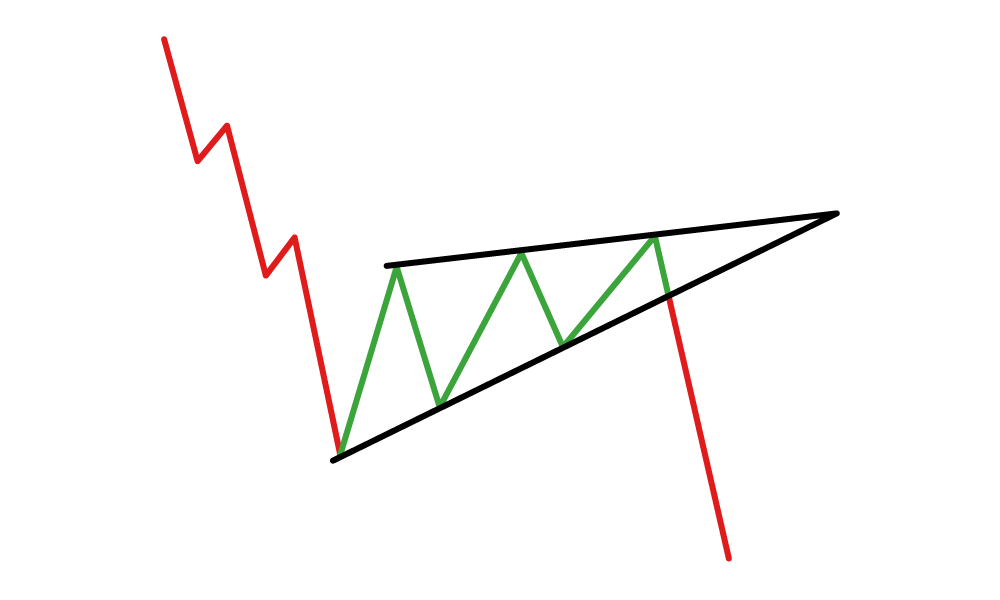
This work of art you see above is known as a rising wedge pattern.
Here is one example of that pattern on the charts, but you can find tons of images on this pattern with a google search.

A rising wedge pattern is a bearish continuation pattern. This is very important. What this means is a rising wedge forms after a long downtrend. It sees upwards price momentum which creates the rising wedge, before breaking down and continuing the downtrend.
Bitcoin fits the bill. A rising wedge has formed after a long downtrend. Now all we have to wait for is the wedge to break. Once a daily candle closes below the bottom trendline, the pattern is triggered.
Will it be because of a strong US Dollar? Will it be a black swan geopolitical event? Or will it simply be the Fed remaining hawkish and the markets pricing in more rate hikes? Or will it simply be bad news about cryptos? It is anyone’s guess. I mention the first three because of bitcoin’s risk on status. If bitcoin is falling, it likely means stock markets are doing the same.

Ethereum actually has a similar pattern, but many crypto traders and investors are saying ethereum’s move is based on fundamentals. The merge surge as some are calling it, which will see ethereum upgrade from a proof-of-work model to a proof-of-stake. This upgrade is set to be completed on September 15th 2022, and the end result will be lower gas fees and faster transactions.
I hate to be THAT guy, but “buy the rumor, sell the news” anyone? I am more of a technical trader, and our reversal was triggered back when there was no merge news. The merge surge to me is just a way that traders are trying to explain this rise when the technicals could have told you this over a month ago. But I will save the battle of technicals vs fundamentals for another day.
When it comes to the technicals, ethereum has closed above a major resistance zone above $1750. The question is if we can hold it. Ever since we broke above it, there has not been a retest. With current market action, perhaps the pullback will lead to a retest of this zone. The bottom portion of the wedge also coincides with this $1750 zone. If ethereum fails to hold above $1750, it would also confirm the trigger of the rising wedge pattern.
So in summary, a bitcoin, ethereum and crypto dump appear to be near. We have a rising wedge pattern which is a bearish continuation pattern which is supported by the fact that both of these cryptos have been rising in a choppy fashion.