Facebook (Meta): Earnings out on February 2nd for Q4 2021 report reported losing daily users for the first time. Stock plunges 20%.
Netflix: Hold my beer.
The N in FAANG isn’t having a great 2022. Netflix stock is down 63% year to date. The stock had an epic gap down sell off after reporting Q4 21 earnings on January 20th 2022, and some traders had fears it would happen again. Deja vu. It did. And I don’t want to just pick on Netflix. Facebook (Meta) could have a repeat of its epic gap down. They are set to report Q1 2022 earnings on April 27th 2022.
At time of writing, Netflix stock has plunged 36%. Shares of the company are down because the company reported it lost subscribers in its most recent quarter. The first time it has lost subscribers in more than 10 years. The last time the company lost subscribers was October 2011.
So much for raising the subscription prices. Netflix cited easing pandemic restrictions and rising competition as reasons for the loss of subscribers. They also mentioned the Russia-Ukraine war.
Netflix reported a loss of 200,000 subscribers during the first quarter, and forward guidance isn’t looking rosy. Netflix is forecasting a global paid subscriber loss of 2 million for Q2. The forward guidance is what really got the sell off going.
The results have led to at least nine Wall Street firms downgrading the stock. There is real fear about the company’s long term growth potential.
“Although their plans to reaccelerate growth (limiting password sharing and an ad model) have merit, by their own admission they won’t have noticeable impact until ’24, a long time to wait on what is now a ‘show me story,’” Bank of America analysts said in a Wednesday note.
“After what can only be called a shocking 1Q subscriber miss and weak subscriber & financial guidance we reduced our subscriber forecasts and pushed back our profitability forecasts substantially,” Pivotal analyst Jeffrey Wlodarczak wrote in a Tuesday note.
I mentioned the Russia-Ukraine war. There are some who believe the loss of subscribers was from people impacted by the conflict. Either Ukrainians canceling subscription based products, or the suspension of services in Russia. Netflix did say in the earnings report that the suspension of its service in Russia and the winding-down of all Russian paid memberships resulted in a loss of 700,000 subscribers.

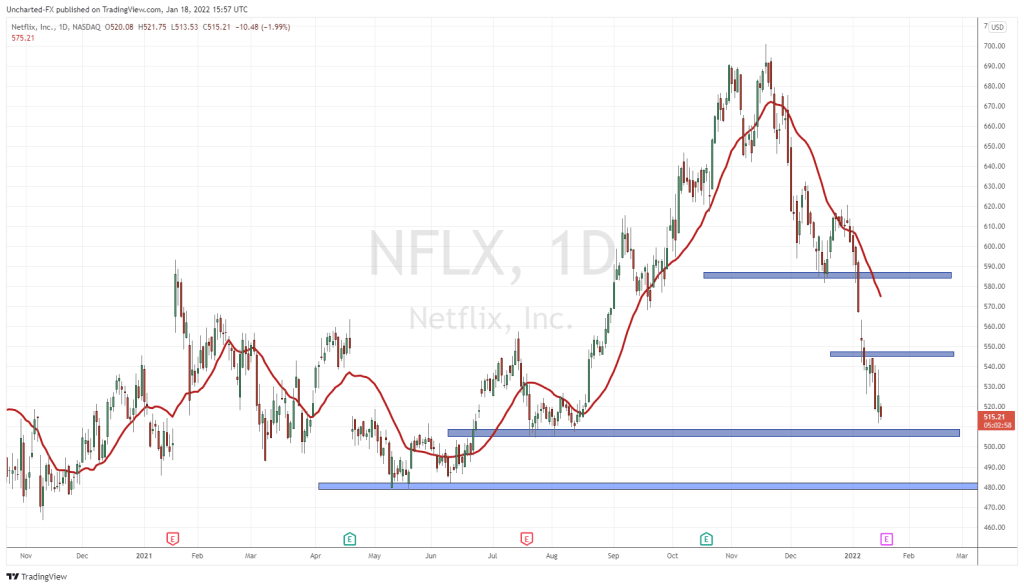
Let’s zoom into the Netflix chart pre earnings. Ignore the big 36% plunge for now. Netflix stock was showing signs of a basing pattern. A potential double bottom was setting up. In fact, on the close just before earnings, things looked positive. We printed an engulfing candle. But then the earnings came out.
Two lessons to impart here. Firstly, guessing earnings is a 50/50 play. I only traded earnings back in my early speculating day trading days. Secondly, basing and reversal patterns are only confirmed by the trigger breakout. For Netflix that would be a close over $400. If you bought in thinking the range would hold here, you got clapped. Many people don’t like the idea of missing out on the move pre-breakout trigger. But this is a business of probabilities. The breakout increases the probability of a successful trade. If you do not get this trigger, the downtrend can still continue. Patience is key to this approach.

Zooming out shows us that Netflix has broken below another major resistance. The $245 zone. If you need confirmation, take a look at the daily candle and how the highs rejected this zone. To me, this means we have already had the retest of what was once support now acting as resistance. We would require a break and daily close above $245 to start thinking about a bounce.
To the downside, I have support coming in at the psychological number of $200. A tip for those trying to find nice support and resistance levels: go to a higher timeframe (weekly) and then switch your chart to a line chart and basically connect the dots. Find zones that have acted as both support and resistance.

To end off, let’s take a look at the Nasdaq. The index is clearly being affected by Netflix…and could see some more volatility with Tesla earnings due out post market on the 20th. My resistance zone at 14,400 is still being rejected. The Nasdaq needs a break above this zone to turn back bullish. As of now, more downside is still possible.