
Last week, US stock markets basically just ranged. To a technical analyst, this ‘range’ was more of a battle to see if bulls could get the price to close over a major resistance zone. This includes the S&P 500, the Nasdaq and the Dow Jones. The Russell 2000 is doing its own thing trying to hold at a major support zone.
Geopolitical uncertainty is weighing in. We are now on our fourth round of peace talks. What the market is worried about is an escalation, or worse, an expansion of this war to other borders. Let’s hope that won’t be the case. But there is one more major high risk event coming up on Wednesday March 16th 2022 that will impact markets. The Federal Reserve.
The Federal Reserve is expected to raise interest rates. Questions are: will it be a 25 basis point hike or 50? How hawkish will the Fed be? Does the Russia Ukraine conflict and government spending more on defense mean interest rates may need to stay lower longer? What does this mean for inflation?
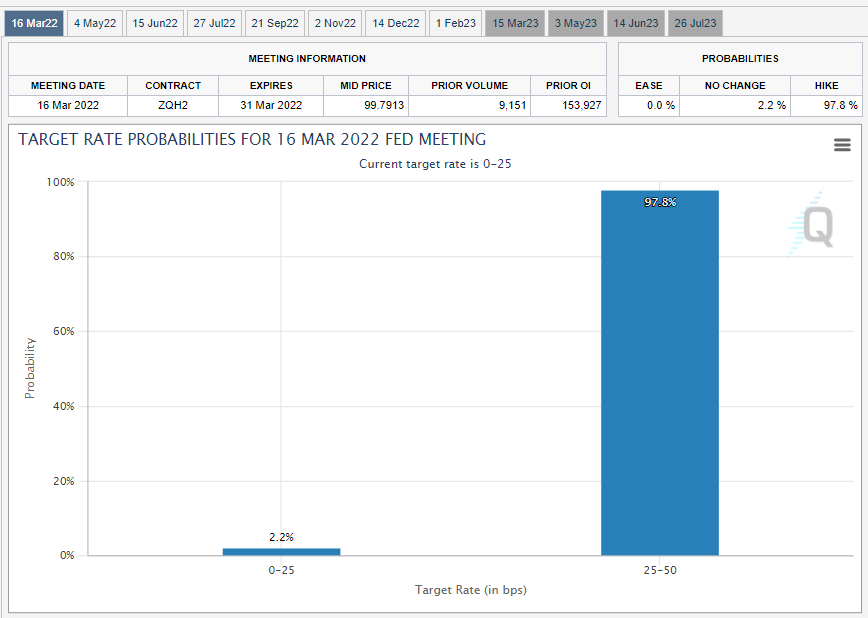
Looking at the CME group target rate probabilities, we are expecting a 25 basis point hike. When the percentage is so high, this hike has already been baked into the markets. Thus, it is all about the Fed’s forward guidance. How hawkish they remain given the current geopolitical situation.
Yes, inflation came in at 40 year highs, but the Fed has an excuse. It isn’t about transitory inflation, it isn’t about corporate greed… it’s now the Russians fault! However, my readers (and anyone who knows anything about central banking) know the seeds of this inflation were planted when money supply began expanding. Once the economy re-opened, we were bound to get this inflation. People with more money are competing for the same number of goods and services since productivity hasn’t increased.
If the Fed really wants to keep cheap money and low rates going, they have an excuse now. But, a deflationary shock would still be needed to tame that inflation. Let’s not go down the rabbit hole for that one.
What actually adds more drama and suspense for Wednesday’s Fed meeting is that Russia may default on her debts! The Russian state has a host of key payment dates coming up, the first of which is a $117 million payment of some U.S. dollar-denominated eurobond coupons on Wednesday. Already fears of a default turning into a global contagion. However, the IMF’s Managing Director Kristalina Georgieva has said a wider financial crisis is unlikely because global banks’ $120 billion exposure to Russia is “not systematically relevant.”
Any headline in Ukraine and geopolitics would get the market back into fear mode. Our media has been mentioning the risk of a chemical attack if the Russians are desperate. That would surely get markets moving. But my eyes and ears will be on the Federal Reserve. A very big week with the Fed expected to hike.
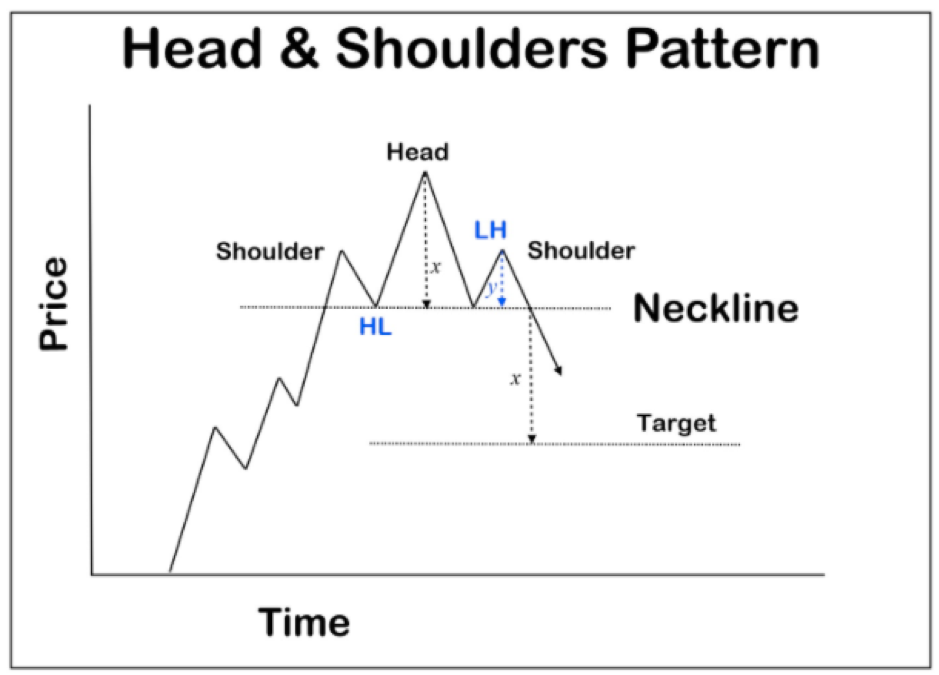
Let’s get to those market charts. A few weeks ago, I did a global tour of equity indices around the world. I noticed that many charts were showing major reversal pattern signals like those of the US. On the week of February 22nd 2022, I wrote a piece titled “Make or Break Week for Stock Markets“. Readers may recall that head and shoulders WEEKLY pattern we spotted on the S&P 500. Technically similar structure on the Nasdaq and the Dow Jones, but the S&P structure just looks cleaner.
We didn’t get that breakout that week. We didn’t get the breakout the week after as well. But on Friday March 11th 2022, the weekly breakdown was confirmed and our head and shoulders pattern triggered.
Let’s get to the charts:

The Nasdaq has entered bear market territory. By definition, a bear market is triggered when a stock or asset falls 20% from its highs. Using my handy dandy ruler tool on tradingview, I can calculate the percentage drop. Traders and media have been saying the same thing too.
The question is what now? Honestly, I cannot say much as we remain between 13,000 and 14,000. The bullish sign would definitely be a close above 14,000. We had this initially, but just no momentum created after multiple days. If the Nasdaq manages to close below 13,000 then I would be looking at a move to 12,000 or 11,000.

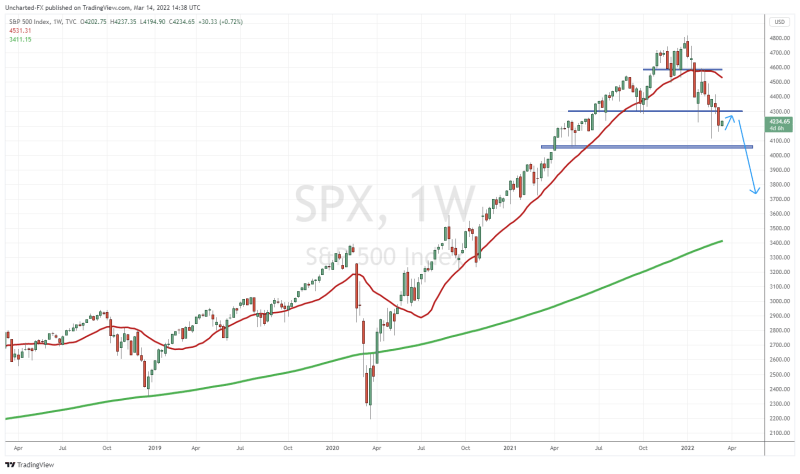
The major concern for me is the S&P 500 chart. A head and shoulders pattern, which we have not seen since 2007 on the weekly chart, has triggered. We got the weekly candle close below 4300 after two weeks of holding above.
The break is bearish, and I would be looking for bears to sell the rips. I have drawn out just a typical breakdown structure. Where prices pullback to retest the breakdown zone before selling off. The break is there, and the catalyst can now come in the form of the Fed or an escalation in Ukraine.
But let’s sprinkle some positivity here. If we can get a weekly candle green close nicely back above 4300, then we have a false breakdown. A fakeout. Which means that the downtrend is neutralized, and the bulls are firmly back in control.