What an eventful past week for Gold. When headlines came out that Russia was conducting special operations in Ukraine, Gold spiked. It was acting as the true safe haven rather than Bitcoin, which we have said still acts as a risk on asset.

Above is the 5 minute chart of Gold from when Russia moved in, until the middle of Thursdays US market session. Gold spiked higher…but then gave up gains near the end of the day. Stock markets regained and closed green.
Gold down, Oil down, and Stock Markets up. Not really what you would expect from war headlines. The markets just completely reversed. The question is why?
There are three reasons in my opinion.
- Markets don’t think this is a big deal and won’t lead to a larger conflict
- Markets are beginning to price in less aggressive rate hikes. Yup, headlines already out about the Fed keeping the cheap money going because of this situation. We expect a hike in March, but perhaps the Fed dot plot changes, and the Fed turns less hawkish. Media will call this the Fed adapting a pragmatic approach given the geopolitical headlines.
- Straight up price manipulation and the plunge protection team (PPT).
With the drops in Oil and Gold, I think we can discount number 2. If there was going to be less rate hikes, Gold would be heading higher. Oil too. BUT there is a chance this is still the case, and this is all just technical resistance zones being adhered too. We will get to that in one second.
That leads to number 1 and 3. 3 is self explanatory. And I know a lot of Gold bulls know precious metal markets are manipulated. The geopolitical drama could play a role because as many of you know, Russia has avoided major impact of US sanctions going back 8 years by owning Gold. Sanctions cause the Ruble to depreciate against the US Dollar and other fiat, but Gold vs the Ruble appreciates, leaving the Russians okay. Chess move. By the way, China has also been stockpiling…potentially for the same reason if they feel emboldened to try something with Taiwan.
This leaves us at number 1. A bit controversial perhaps, and I am not saying I agree with this. Obviously war is bad. But I am just trying to explain why Gold may have sold off. The markets don’t think this Russia Ukraine situation will lead to anything larger. Perhaps it is because the US is not getting involved. The other thing I have been seeing on social media is the lack of videos to scare market participants. As odd as this may sound, but if there were more videos of tank columns and soldiers etc, that may have scared the markets. I have found with my experience watching MSM videos that they keep replaying the same videos. This is what some call the ”fog of war”.
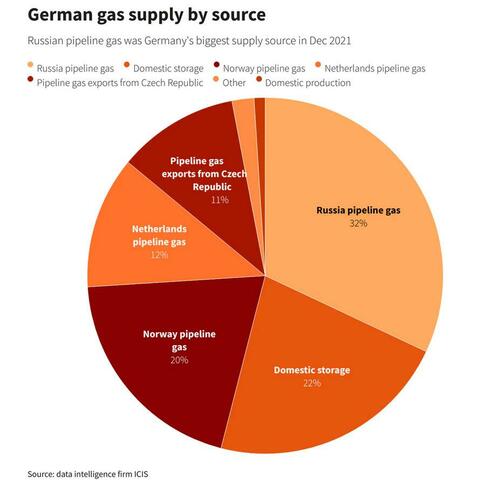
If the above is correct, and we see major escalation videos come out by the new trading week, watch for markets to drop and Gold to pop. If we see major escalation, say with Poland or Finland, or even with China and Taiwan, watch for markets to drop and Gold to pop. The biggest escalation would be if Russia is dropped from the SWIFT payment system. Currently, major European nations such as Italy and Germany oppose this…because well, they require Russian energy. You are already seeing headlines of India preparing to create a payment system with Russia in case this happens. Russia and China have been working on their own SWIFT payment system for many years now.
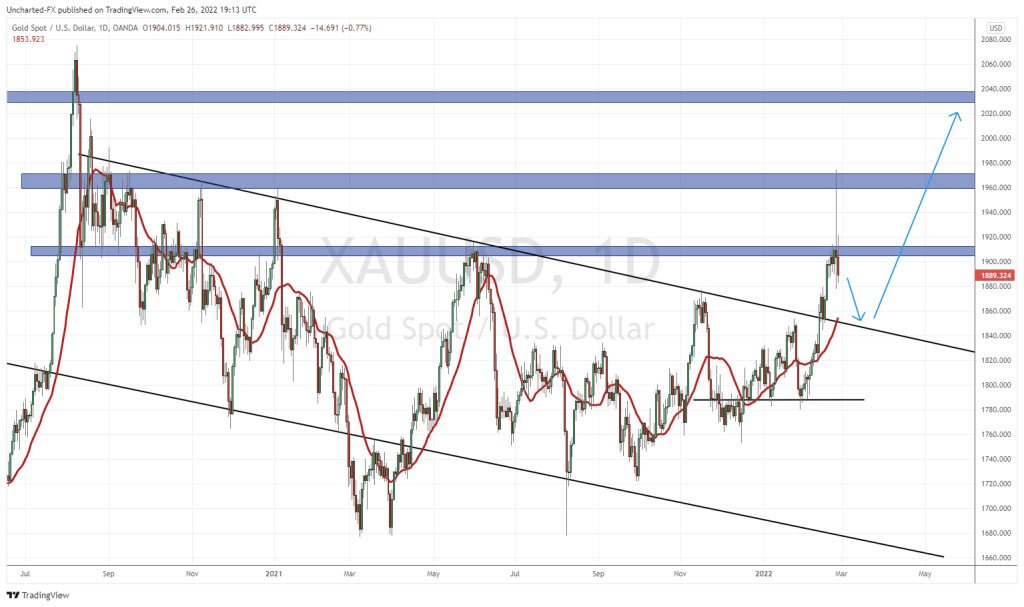
So now let’s get back to that Gold chart…which has surprised many bulls:

Look at that candle on February 24th 2022, when the markets began trading the Russia conflict headline. We spiked above our resistance zone, and hit our second resistance zone at around $1970. You guys know me, I wait for daily candle closes to confirm the breakout. This is a very good example why. Gold actually closed RED. Yes. We closed red. We gave back all those gains, for the reasons I explained above. Many people were surprised, but the markets just aren’t scared of this current situation in Eastern Europe. That could change as I described.
Technically, we did not close above the resistance at $1910. Had we done that, then we would be working with a new breakout. Instead, we have a fakeout as indicated by the large candle wick. Personally, I think this means Gold pulls back to the trendline breakout as pictured with my arrow. From there, we could bounce higher…and there could be a fundamental reason for it. The Federal Reserve. On March 16th 2022, the Fed is expected to raise rates. It wouldn’t be great for Gold, but perhaps the less hawkish statement will see Gold rally. If the Russia Ukraine situation is cause for the Fed to keep cheap money going, Gold will rally.
Maybe this causes a new arms race, and the US government will need to spend more on the military. They would want cheaper interest rates since they have a large debt bill.
To summarize Gold, I remain bullish in the long term. The technical breakout from our trendline still remains intact. The pullback would just be normal breakout price action. I think more geopolitical headlines and uncertainties in the future are coming. And I also believe the Fed may come out less hawkish on the interest rate side, meaning they will need to live with inflation. But hey, if things escalate, the Fed can now blame Russia for higher oil prices and thus higher inflation rather than their monetary policy. In a way, Putin has just saved the Federal Reserve. They can save face and blame something else. Maybe even retire the transitory inflation story which they could only keep running until mid 2022.
So how to play this? Well, I love the physical. I also suggest holding large cap royalty and streamers because they make money and pay a dividend regardless of what the price of Gold and Silver are. We can also play other types of Gold stocks. In this article, I will present an option from a junior, an up and coming producer, and a company that deals with royalty and streamers. The junior is the more riskier, but can provide a larger return. The royalty and streamer is pretty safe, and will provide you with consistent gains. I should note that if you are like me who favors the technicals, the entire Gold space will move higher if the prices of Gold shoot higher.
Falcon Gold (FG.V)
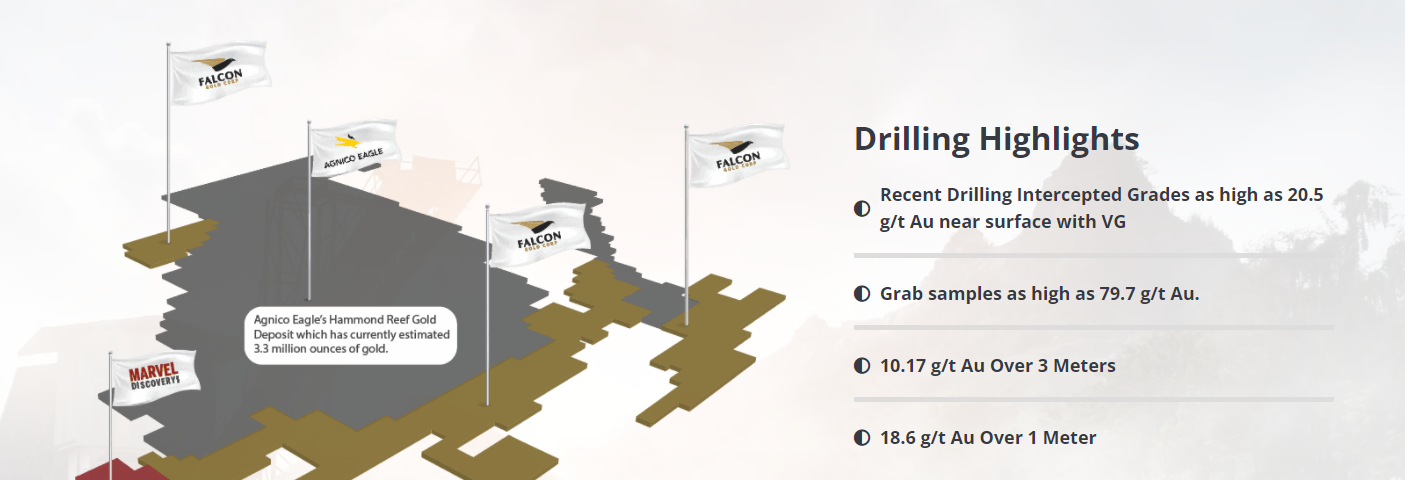
Falcon Gold (FG.V) acquires, explores, and advances quality mining projects in the Americas. Their assets are in Canada, Chile and Argentina with their flagship project being Central Canada and bordering Agnico Eagle Mines 4.6 million ounce Hammond Reef deposit.

The majority of their properties are next to large proven deposits or (past) producing mines. Which means the veins could extend onto their land. This creates an exciting prospect for great drill results which is a major catalyst for the stock price. The hope is one of these assets hits something big and more drilling begins to unveil a resource. Then, perhaps a larger miner jumps in with a joint venture, or just straight up buys the asset.
Management has acquired properties for the cheap when the precious metals markets were low, and continues to de-risk them. The Central Canada project is having an upcoming phase III drill program which begins in March 2022. To date Falcon has completed 26 diamond drill holes totaling 4,058m since 2020. Phase III is planned for 3 holes totaling approximately 1,000m. Drilling will target the J.J Walshe Zone at vertical depths between 200 and 300 m to extend the gold bearing zones beyond the current drilled depth of 160m (see below image).

Highlights from the previous programs at the J.J. Walshe Zone include 1.35 g/t Au over 4.1m starting at 59.5m downhole in CC20-15 and 1.57 g/t Au over 14.8m starting at 89.6m downhole in CC20-12. This interval contained visible gold which assayed 20.50 g/t Au over 0.3m. Hole CC20-12 also contained 10.8 g/t Au over 0.3m starting at 112.4m downhole. The Central Canada Mine Trend has now been traced for 275m in strike length and to a depth of 160m.

Technically, the chart is shaping up nicely. I wrote about the cup and handle reversal pattern around mid January 2022. We got the break, and the retests of $0.075 are holding. As long as we remain above this level, more upside is very possible. Notice I have drawn a horizontal line at $0.09. This is our interim resistance. The stock is ranging between $0.075 and $0.09. We just need a candle break and close above $0.09 for a move up to $0.12. Once we get past $0.012, that’s when the real move begins.
Overall, I must say Falcon Gold sure looks like it bottomed. A cup and handle pattern is a very good sign. And so far we have not been able to close back below $0.09 which is another great sign. If Gold continues higher, Falcon Gold will provide us with a great return.
Gold Mountain (GMTN.TO)
Gold Mountain is an upcoming producer. Gold Mountain Mining (GMTN.V) is a BC based exploration and development company focused on the 100% owned Elk Gold project. This project was once owned by Equinox, and Gold Mountain acquired it back in 2019 when Gold prices were down. The asset was a past producer with 97 g/t average.
We here at Equity Guru are quite excited because the mine is not too far away from us, AND the company was issued a mining permit here in BC.
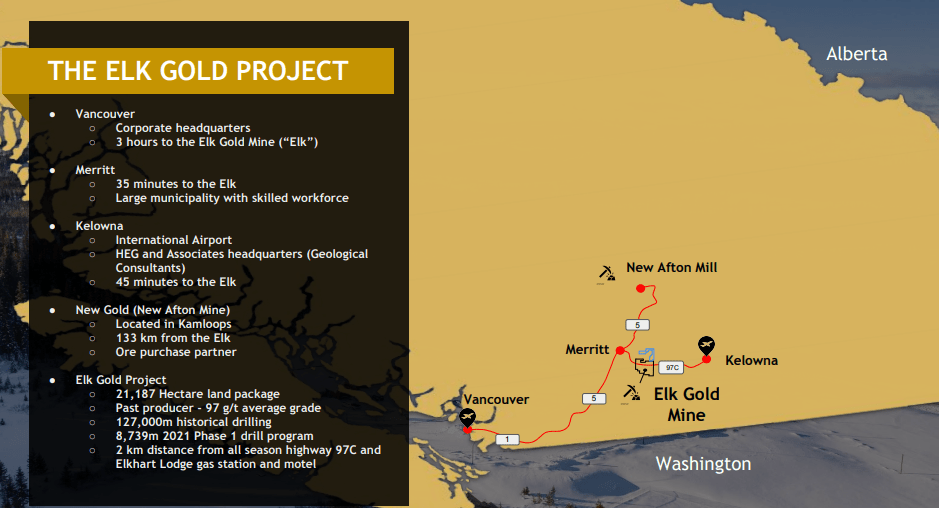
The company recently delivered the first shipment of ore to New Gold inc. This first load of ore delivered to New Gold’s New Afton mill marks the official commencement of production and the beginning of cash flow and revenue generation for the Company and its shareholders.
- Following the extended provincial review and approval of New Gold’s custom milling permit, the Company is now positioned to deliver high-grade ore to accommodate its Year 1 production profile.
- The material was mined from the 1300 vein near historic Pit 2, which was last mined from 2012 to 2014 at an average grade of 16.7 g/t.
- This initial delivery marks the Company’s transition into cash-flow and revenue generation.
- Under the terms of the Ore Purchase Agreement with New Gold, the Company will be paid on a monthly basis for all ore delivered.
- Ownership of ore transfers to New Gold upon delivery, eliminating all risks of recovery for Gold Mountain.
Our mining expert, Greg Nolan, discussed the economics of the Elk project in his latest article:
Elk’s economics are compelling. The LOM all-in sustaining cost (AISC) is $554 per oz. This puts Gold Mountain at the lower end of the cost curve for a gold producer.
These are (potentially) high-margin ounces. Again, it’s simple math:
- Gold currently trades at roughly $1,800.00 per oz
- $1,800 – $554 (AISC) = $1,246 per oz
- $1,246 per oz x 19k ounces (projected rate of production per annum) = $23,674,000
An annual production rate of 19k ounces is projected for years one thru three. Beginning in year four, as per an enhanced OPA with New Gold, the Company plans to scale the operation via increased delivery commitments to the New Afton mill—from 70,000 to 350,000 tonnes. This 400% bump is expected to produce 65,000 ounces per annum. Once the Company fires on all cylinders, we could see yearly production top 100,000 ounces via multiple open pits and an underground operation.
Check out Greg’s article for the ounce count and the exploration upside. In a nutshell, Gold Mountain is beginning to produce and make some cash now, then use that money to explore and expand the project and the resource.

On the technicals, Gold Mountain is another Gold chart that I have spoken about in the past. Just recently, we have confirmed a reversal pattern (do you see this theme with the Gold stocks?). We printed a double bottom pattern at the $1.20 zone, and confirmed a retest of it. We remain bullish on the stock above $1.35, and expect multiple higher lows and higher highs. There seems to be some interim resistance at $1.80, but the major resistance comes in at $2.00.
Again, with Gold potentially pulling back to retest our trendline, Gold Mountain could pullback to the $1.35 zone once more, allowing us to enter on the pullback. Of course, it will depend on Gold holding above that trendline retest, so watch for that and watch for a nice green candle on Gold Mountain on the $1.35 retest.
Globex Mining (GMX.TO)
Globex Mining (GMX.TO) calls itself a mineral property bank. And for a very good reason with a whopping 204 projects covering a variety of commodities, not only Gold:
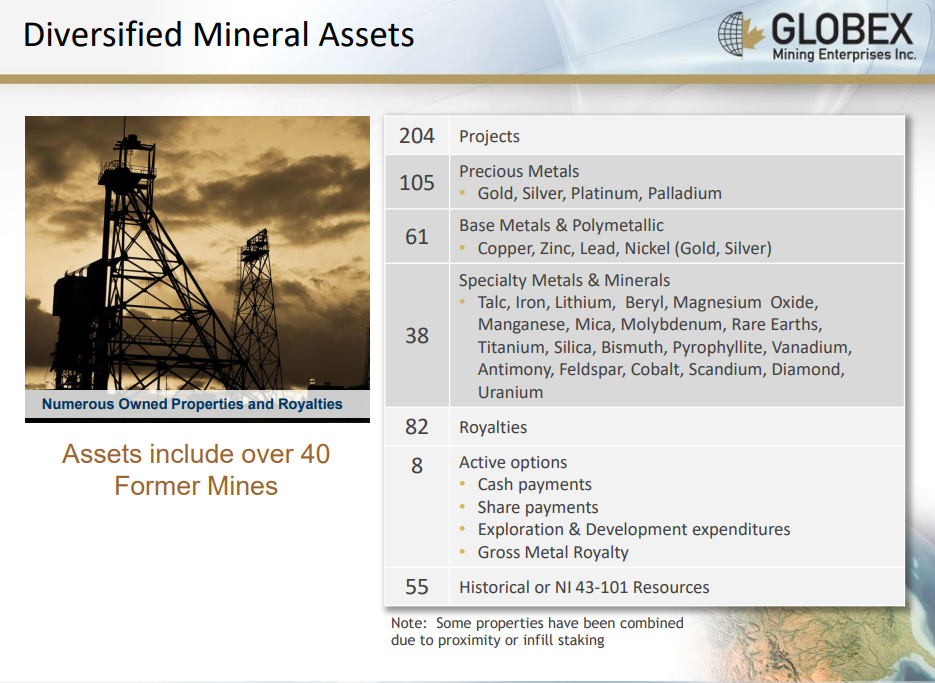
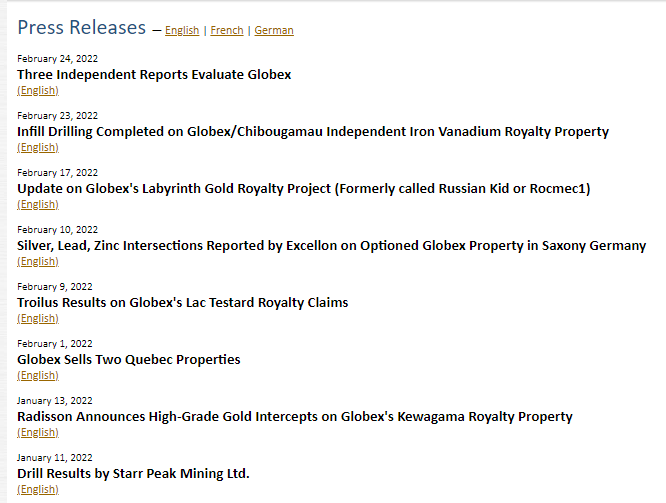
With that many assets, news flow remains quite consistent:
This is definitely a company worth considering especially if you are bullish on ALL commodities like I am. I think it’s the inflation trade, and with Globex having a mineral bank, the company will surely benefit from higher commodity prices.

The stock recently made highs not seen since 2012 back in May of 2021 hitting $1.50. And guess what bulls? We could be testing those recent highs once again. We also have a nice reversal pattern and the stock is currently retesting a major support level. $1.25 is a major support zone and buyers did step in here last week on Thursday. The worry is that pullback on Gold. This could cause a deeper pullback on Globex down to $1.10. There is where the previous higher low is, and the stock remains in an uptrend as long as we remain above it.