US Stock Markets, and the world Stock Markets are showing me signs of direction. Since breaking down, stock markets have been in what I refer to as ‘no man’s land’. In technical jargon, in a space where the downtrend can still continue with a lower high, or prices must climb above resistance to neutralize downside pressure.
Personally, I have been trading forex, crypto’s and commodities more in the past few weeks. Yes, I have traded some individual Canadian names, but I have not touched the Stock Market indices. That could be about to change, as I am seeing signs that the downtrend here may be neutralized.
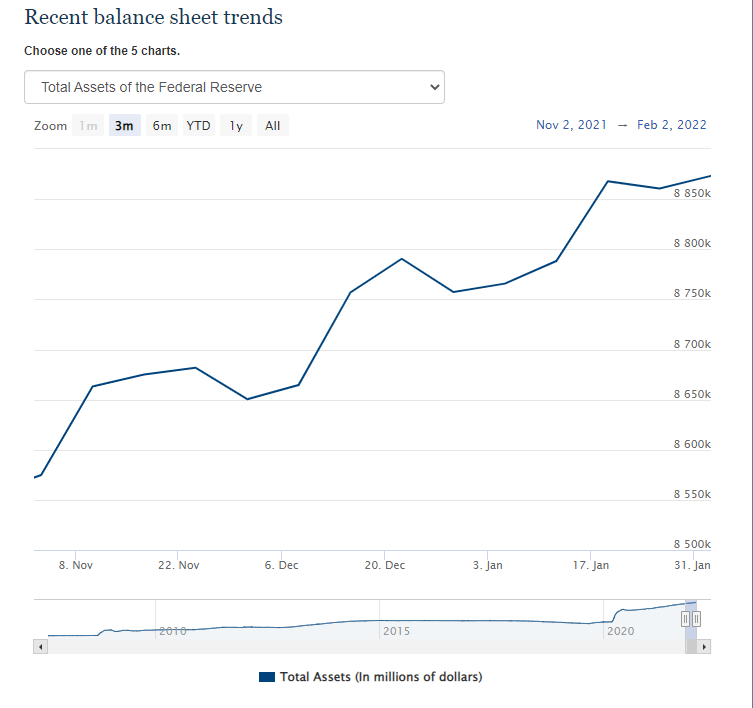
The reason? Well firstly this:

New highs on the Fed Balance Sheet.
Also, Fed Presidents are now turning less hawkish. The Stock Markets have been predicting five interest rate hikes this year. It seems now many Fed Presidents are saying three for sure…and maybe four to five depending on the economy. A more pragmatic ‘we’ll see how it goes’ approach.
Take for example Atlanta Fed President Bostic. He says he expects the Fed to hike three or four times this year, but the Fed isn’t locked into a specific plan. CNBC said that the policymaker signaled a view that is less aggressive than the market’s on rates.
Fed President Bostic said:
“In terms of hikes for the interest rates, right now I have three forecast for this year,” he said. “I’m leaning a little towards four, but we’re going to have to see how the economy responds as we take our first steps through the first part of this year.”
A bit different compared to the markets pricing at least five and possibly six hikes of 0.25 percentage points each. Bank of America recently forecast seven moves as the central bank fights inflation running at its highest level in nearly 40 years.

As always, I am keeping my eyes on the 10 year yield. If this can weaken, the stock markets will really like it. If we jump over 2%…then the stock market pressure will continue.
Let’s take a look at some (okay a lot) of stock market charts.

Beginning with the Dow Jones, and we are currently above a resistance zone that we took out weeks away which led to the large pullback. If we can confirm a daily close today or later on this week, then we are back on the path of making new record highs. Some technical purists may say that this resistance zone doesn’t matter much, and more emphasis should be put on the lower high up at 36325.

The Russell 2000 is looking like a good long trade if I will be honest. A trade that I would only add onto if we can close above the major resistance above at 2120. That is the MAJOR inflection point for us.

What about technology? It’s looking good, but nothing I would act on just yet. The 15,600 zone is still the major resistance that needs to break before I turn full bullish.
Let’s take a look at other major market indices around the world.

One of the markets I may act on soon is the Japanese Nikkei. We broke below a major support zone but no follow through on the retest. Bears could not add more selling pressure. Instead, we have recovered and seem to be breaking out. I like the daily close, and the move above my moving average. This index is at the top of my list for a CFD trade.

Sticking with Asia, the China 50 is looking bullish. Bouncing at support, and a trendline plus moving average crossover. The Shanghai composite Index is also bouncing at major support.

Let’s end off with a European stock market. Nice recoveries in the UK, France, Italy and many more. Above I have the German Dax…if you remember, German Bunds actually turned positive last week.
The German markets looked in danger of breaking down below a major support at 15,000. Instead, we have bounced from this support and things are looking positive with the overall markets rising. I am watching for a break above 15,700.
So in summary, stock markets are beginning to look interesting again from a market structure perspective. I am still waiting for those daily candle closes, but we are getting closer to confirm a break out of the no man’s land.

