
Just last week, I put out my cryptocurrency 2022 outlook. In said outlook, I said something which might have ticked off some crypto bulls. In my opinion, and well we have the evidence right in front of our eyes, Bitcoin and other cryptocurrencies still move as a risk on asset. They do not act as a safety, or risk off, asset. Some crypto bulls say you need to be in Bitcoin because of the fall in fiat. I agree with them, however, the divergence still isn’t there.
When will that divergence occur? Where Bitcoin and cryptocurrencies diverge and stop correlating positively with equities turning into risk off assets? I think it happens when the currency crisis occurs. Others quickly point out that Bitcoin and major cryptocurrencies have no price action during a recession or depression. We still need to see how they will react during an economic downfall similar to the Great Financial Crisis of 2008. In the shortest recession ever, during the global lockdown in early 2020, Bitcoin did fall with everything else. Even Gold did not act as a safe haven during this time. Money fled everything and ran into cash.
Knowing that Bitcoin has a positive correlation with stock markets due to its risk on status, today’s theme is all about support. Equity markets are at MAJOR support zones. I will be honest with you, things look a bit gnarly as I write this. We still have over 5 hours of trading to go in the day, but currently, stock markets are under pressure and the Nasdaq is in danger of starting a new bear market. The support level I mentioned in yesterday’s Market Moment post is being tested. Uh oh.
Let’s take a quick look at equities, and then compare it to the Bitcoin chart. All these are the daily chart, with the current candle being today’s price action, which will close at the end of the trading day.

The S&P 500 dropped hard yesterday failing to print and close into new record high territory. Today, we are now testing a major support zone, with the current price action not being positive for bulls. If we were to close like this, we would have a support breakdown confirmation. The next zone of support would be my lower channel trendline. A close below that, and the uptrend is gone.

The Dow Jones is sort of in the same boat. This market has held relatively well compared to the others. I have said it is because money would run into good dividend paying stocks as the dividend yield is better than bond yields. We have pulled back to retest the breakout zone of 36,400 as support. Would love to see buyers step in and defend just like they did on Jan 3rd, 2022.

The Nasdaq is the one I am really watching. A huge support zone. If this does not hold, and we close below 15,600…not only do we break support, but also break below the lower channel trendline. The uptrend and bull market would effectively be over. A new bear market would be initiated.
The hope is that buyers defend this support, and we bounce back. Continue this range. Watch the Nasdaq for the bid, because it could have a say to whether or not other equity markets hold support. And yes…it would be a positive sign for Bitcoin.
The one worry? Bond yields. I detail that in this article where I go over the reason equity markets, particularly the Nasdaq, are under pressure. Not from Covid variants, but from fear the Fed’s cheap money policy is ending. A hawkish Fed has the stock markets concerned.
As you can see, support tests seem to be the theme right now. The same can be said on Bitcoin.

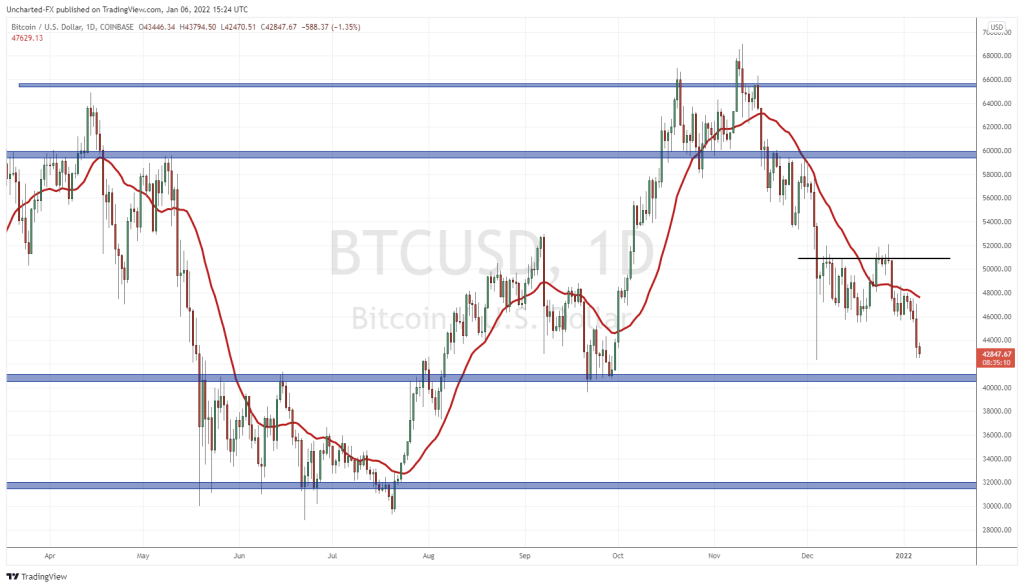
Bitcoin has been in a clear downtrend. There was some hope this was going to reverse with the close over my moving average on December 23rd 2021. It was close to the $50,000 which seemed like a great level to confirm a reversal. What I was waiting for was the breakout above $51,000. Not only would this confirm a double bottom breakout pattern, but more importantly, we would take out the previous lower high.
As long as the lower highs are held in any market, the downtrend remains intact. Unfortunately for Bitcoin bulls, we did not break above. The sell off continued, following the trajectory of stock markets. Risk on assets sold off.
As I said, support is the theme for equity markets. Bitcoin is also at a major support zone. I would say there is a bigger support zone between $40-$41k as evident by my chart. However, take a look at the price action on December 4th 2021. Big wick candle. Not exaggerating. That is a big wick if I ever saw one. Wicks like this indicate heavy buying. Remember, that candle was once fully red, but the buyers came in force to push up the price.
We know there are buyers in this area. Bulls have stepped in here before. Will they do so again? Just as a trade, I bet some Bitcoin traders took positions then and nestled their stop loss below the large wick. So if we push below it, then it could trigger stop losses which take us lower to the $40k support zone.
In summary, Bitcoin and US Stock markets are testing major support levels. Both have a positive correlation being risk on assets, and a successful support hold on either will impact the other. A good place to potentially buy the dips. My readers know my approach, I want to see how today’s daily candle closes. Ideally going forward, I would love to see a nice large green candle at these support zones, or a hammer candle with a large wick indicating buyers stepping in to defend.