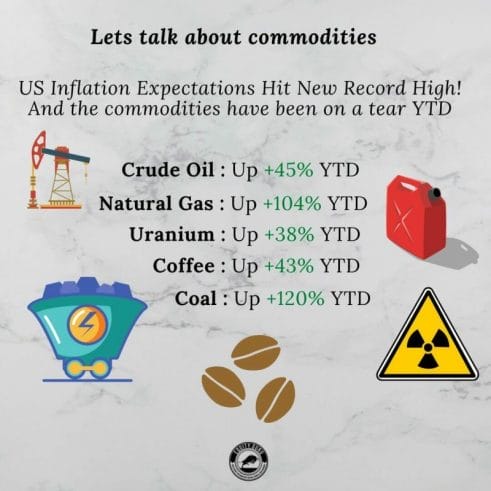
It has been the year of commodities. We had pops in the precious metals earlier this year, only for them to give back all of their 2021 gains. The economy re-opening play was focused on Oil and Dr. Copper. Both commodities are still holding double digit gains year to date. Both have flag patterns on their charts, and Oil JUST triggered a breakout. Lumber has been a roller coaster ride. Big gains, and then a dump. And then we had steel go on a run…with a lot of analysts worrying it might follow the same roller coaster trajectory as lumber. Right now the craze is Uranium. Even the retail traders on WallStreetBets are loading up. #UraniumSqueeze anyone?

I missed out Coal, which is up 120%. To add some drama here, Equity Guru’s Taku said he would rather be long Coal than Uranium.
If we add the agricultural commodities to the pictures, we see that commodities make up the top of the year to date gainers list. But to be fair, also round up the top losers year to date:

Today is all about a move that took many people by surprise. Natural Gas. A big mover, and we’ll take a look at the charts in just a minute.
The spike in Natural Gas occurred when data came out indicating that storage reserves were low for this time of the year…at a time when colder weather is just around the corner. Supply and Demand mechanics are in play as production is getting hampered by a tropical storm heading to the Gulf of Mexico.
Even in the U.S., the amount of gas in storage is 7.6% below the five-year average, according to recent data from the U.S. Energy Information Administration. Natural gas is an important heating fuel and is responsible for about 35% of power generation in the U.S., the federal agency found.
Gas shortage is happening in Europe as well. The usually quiet market is popping on fears there is not enough gas reserves stored up. Demand is increasing, but supply remains below normal.
The real fear will come in a couple of months time, when we begin to get hints of how cold this winter will actually be. There are even some analysts claiming prices can still double from here, and top $10 or more. This is the price required to provide an incentive to fulfill domestic natural gas demand.
All I can say is this sucks for the middle class. We have just been spending more on oil for cars, now we are set to pay more for heating our homes. You have probably realized that this will impact inflation data going forward. Inflation isn’t looking too transitory.
Here in British Columbia, Fortis BC is set to raise gas prices in October.
Customers on the Lower Mainland, Vancouver Island, the Interior and Revelstoke will see their gas rates jump by $1 per gigajoule as of Oct. 1. Based on average natural gas use of eight gigajoules per month, customers in those areas will see their monthly rate rise nine per cent, or about $8, the company said.

Fortis actually looks ready to pop into new all time record territory.
So who benefits? I would think the Russians. But let’s not forget that the US is also an exporter of Natural Gas in the liquid form, LNG. With the top customers being South Korea, China and Japan.
The Russians had to recently cut back supply to Europe, but the new Nord Stream 2 pipeline, which is going to double Russian gas exports to Europe, could resolve much of these problems. Geopolitics is the issue right now, with Germany now having 4 months to complete certification of Nord Stream 2.
“There’s different explanations for what’s going on, why Russian supplies are constrained,” said Yergin. “Russian and German regulators are in a debate as to whether new regulations apply that were put in place after the pipeline was given its final investment decisions.”
As I write this, what comes to mind is that infamous Putin song on Youtube, which apparently is now the unofficial Covid-19 anthem. Where he says, “I have Gas you see, don’t play games with me. You want my Gas? Well you can kiss my ass?” while he inserts a plug into an outlet and pulls it out showing the lights in Europe turn on and off.
Enjoy.
Let’s wrap up with a look at the Natural Gas chart. And for this, we will have to zoom out to the weekly chart.

Our good old line chart too so we can see levels much better.
As you can see, we actually had a pretty big breakout. Some would argue this happened above $4.00. Whatever the case, a breakout has happened. This is bullish for natural gas any way you look at it.
I am looking at the $6.00 zone for the next resistance area, and then from there, $8.00 is a major flip zone.
Commodities are hot, and I think there is good reason. Sure, there are REAL supply and demand issues, but I go back to something I said earlier this year and last year. In this environment where stocks, bonds, real estate and some crypto’s are expensive, commodities still look cheap for money looking for yield.

