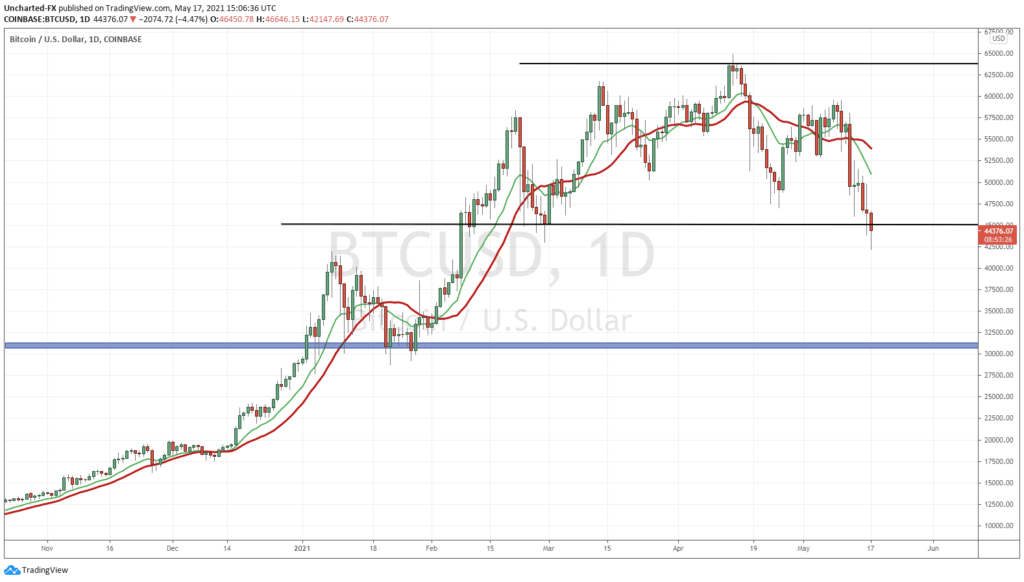
Is the Bitcoin bull run coming to an end? In last weeks Market Moment aptly named “Elon Musk Cucks Bitcoin, but is it Still a Buy?“, I analyzed the technical levels on Bitcoin. I expressed concern of a topping pattern and a bull run/uptrend completion. Under the Technical Tactics portion of this article, I will review the technicals once again.
We cannot discuss the price action in the Bitcoin markets without mentioning Elon Musk. The poster boy of the recent meme/retail crowd fueled run into cryptocurrencies has been getting some heat. To be honest, I haven’t seen the retail crowd turn on one person like this before. His cult of personality is definitely taking a hit…and rumors are abound that he may even announce his own cryptocurrency called TeslaCoin. If this is true, I am looking forward to how the retail crowd reacts to this. Keep in mind, Elon Musk tweeted last week how Tesla will stop accepting Bitcoin for transactions due to its energy usage and environmental concerns.
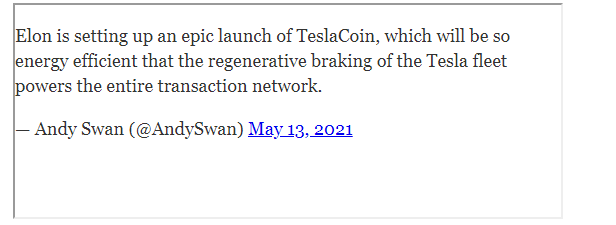
The days of scoping out Twitter accounts remind me of the days when traders used to monitor President Trump’s Twitter account for tweets whenever Stock Markets flipped red. Earning him the name, President Donald Pump.
Over the weekend, Bitcoin took a further dump to our major make or break support zone when this was tweeted:
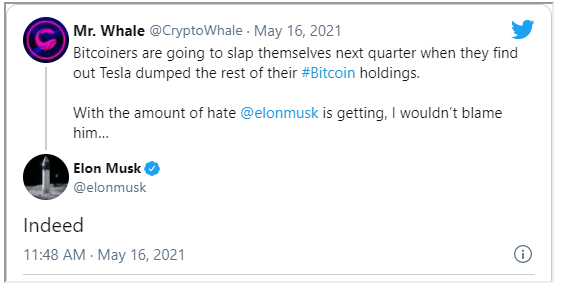
Implying Elon Musk and Tesla have sold their Bitcoin holdings. You can’t blame the guy for taking profits at the top if this is true, but the phrase “pump and dump” comes to mind for many of the retail crowd.
A quick aside: In last weeks Market Moment, I discussed the Retail crowd leaving stocks for crypto’s, well look at the price action of the meme stocks today : GME, AMC, BB etc. They are getting a nice bid. This is happening when Bitcoin and other crypto’s are taking a hit. Could this mean retail money is heading back into the meme stocks? We shall watch for further confirmation this week.
Back to Musk.
In my years of trading, one thing I always see is how media articles and news comes out in droves when a certain asset is testing a major support level. If that support level breaks, a reversal occurs, so in a way the media and others are attempting to hold this support. Elon Musk and Michael Saylor tweets are evidence of this.
As Bitcoin is breaking below support, earlier this morning Elon Musk confirmed that Tesla has NOT sold any Bitcoin, a very different tweet tone than that posted above:
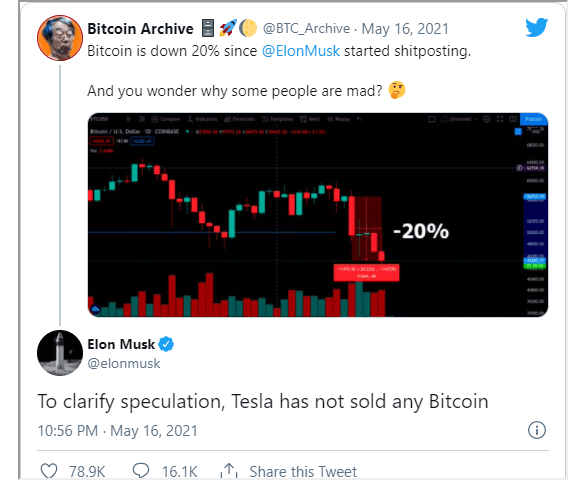
Once again, his cult of personality is taking a hit. If you want to see some of the hate directed towards Elon on Twitter, take a look at this Zerohedge article. Warning, there are a lot of f bombs dropped.
If you are a holder/hodler of Doge coin, things aren’t looking too bad on the Elon Musk Tweet side. He still tweets about it and is literally taking it to the moon.
Honestly, this was how things were back in the first crypto mania. Tons of celebrities and big names were tweeting about crypto’s. Pumping and dumping. Because there are no regulations, this was fine. John McAfee is the name that comes to mind. But I even remember the crypto Tron, with many people implying Chinese Billionaires would jump on it.
I still believe regulations are coming. I have given my thoughts on why this would be bullish: it allows Wall Street and Institutions to hold token and coins knowing there is depositor insurance. But the price is it will defeat the original ethos of cryptocurrencies which was to be out of reach from big government, corporations and banks.
Technical Tactics
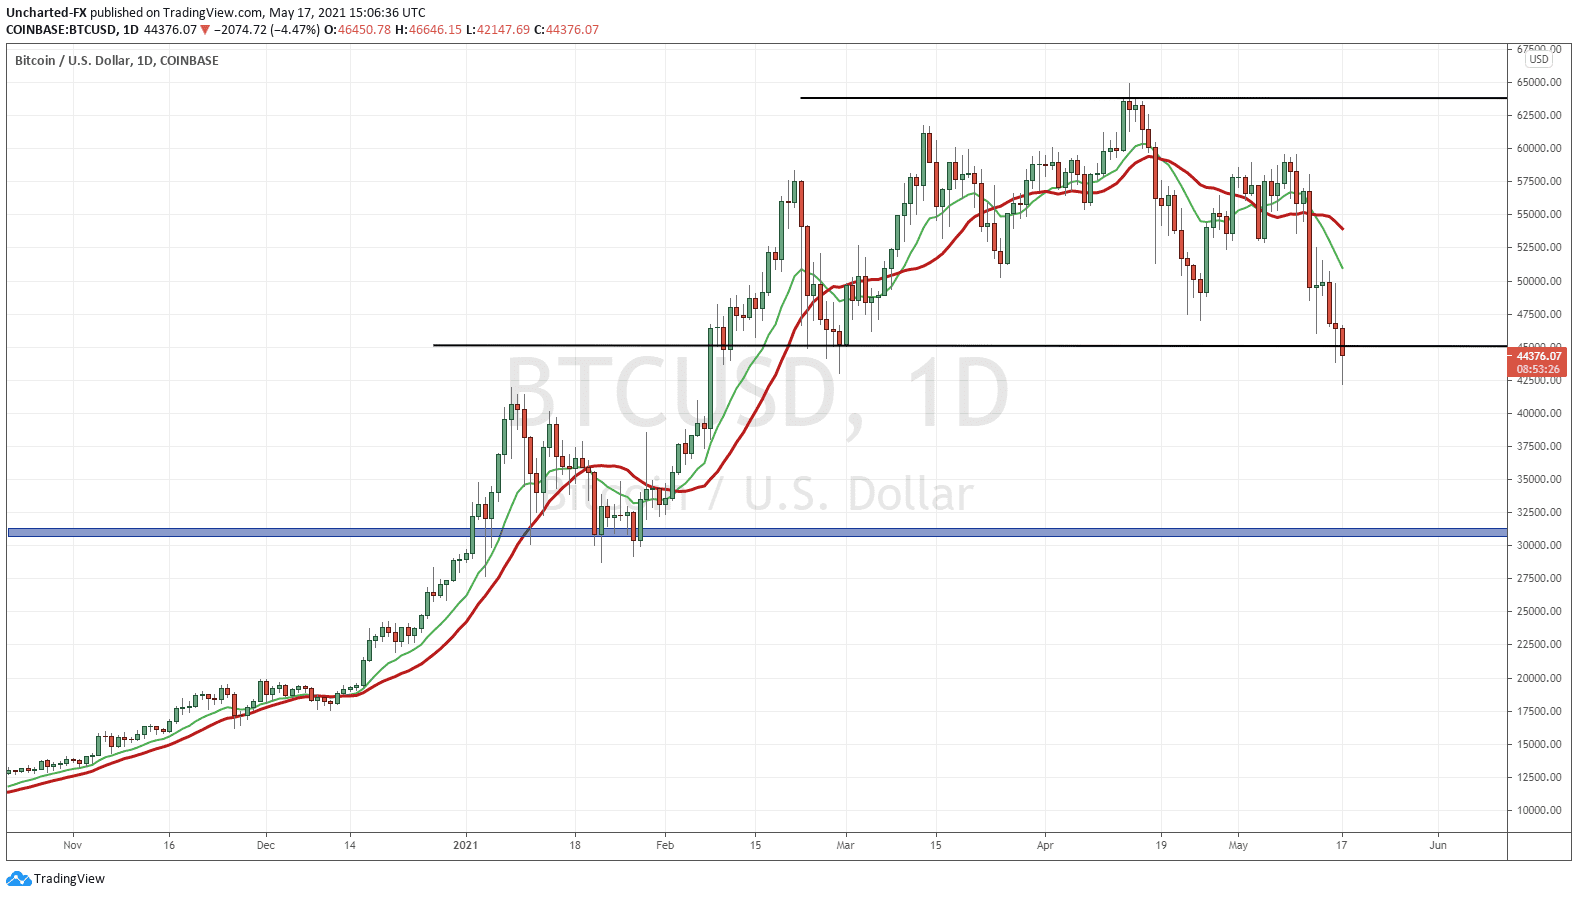
Regular readers of Market Moment are familiar with this Bitcoin daily chart. Many signs of an impending reversal. Currently, we are breaking below support (price floor) which will be the trigger for more downside targets.
Some would argue the support was at $50,000, which is a big psychological number. As you can see from the chart, there are more support levels below, and I drew my line at $45,000. First of all, readers know that I call support and resistance ‘zones’, because they really are not just one price level. These zones account for multiple support or resistance levels close together.
Switch to a line chart to find support and resistance levels properly, but another trick is this:
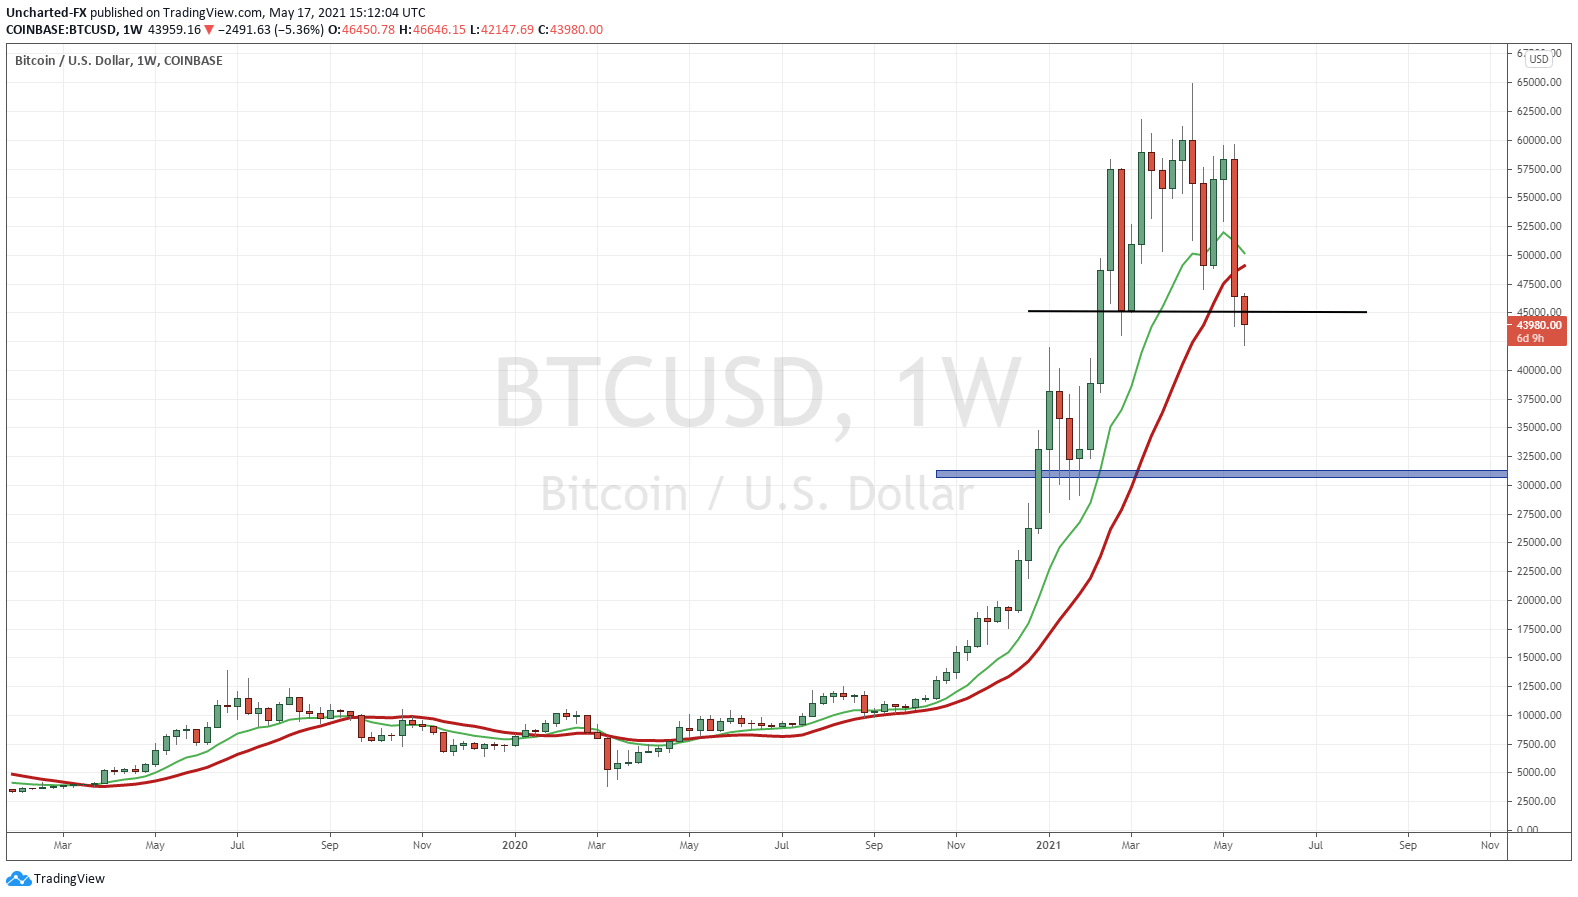
Yup that’s right, just switch to a higher timeframe. Above I have the weekly chart of Bitcoin where each candle represents one entire week of price action. For the past few months, Bitcoin has been ranging between $45,000 and $60,000. Another sign of topping. The key though is still the breakdown of support. Support is more obvious here. Right at $45,000. If you have doubts, you can switch to the line chart.
So when you are in doubt because there are so many support and resistance levels all packed nearby to work with, just go to the higher timeframe.
What comes next for Bitcoin? Is it in danger of a new downtrend. The answer is yes, hence why I am not surprised about Elon’s tweet this morning as an attempt to hold above support. Bitcoin must hold above $45,000 on the daily to remain in an uptrend. If price closes below, we could pullback to retest $45,000 before falling further below. Our downside target for this scenario is $32,000-$33,000.
We’ll definitely be keeping our eyes on the Bitcoin close over on Equity Guru’s Discord Channel.

