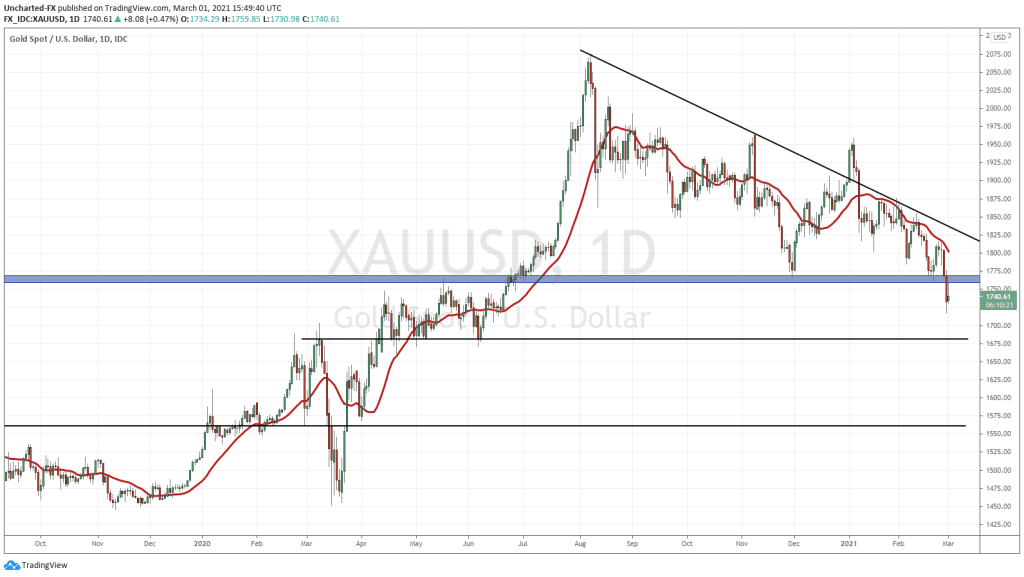
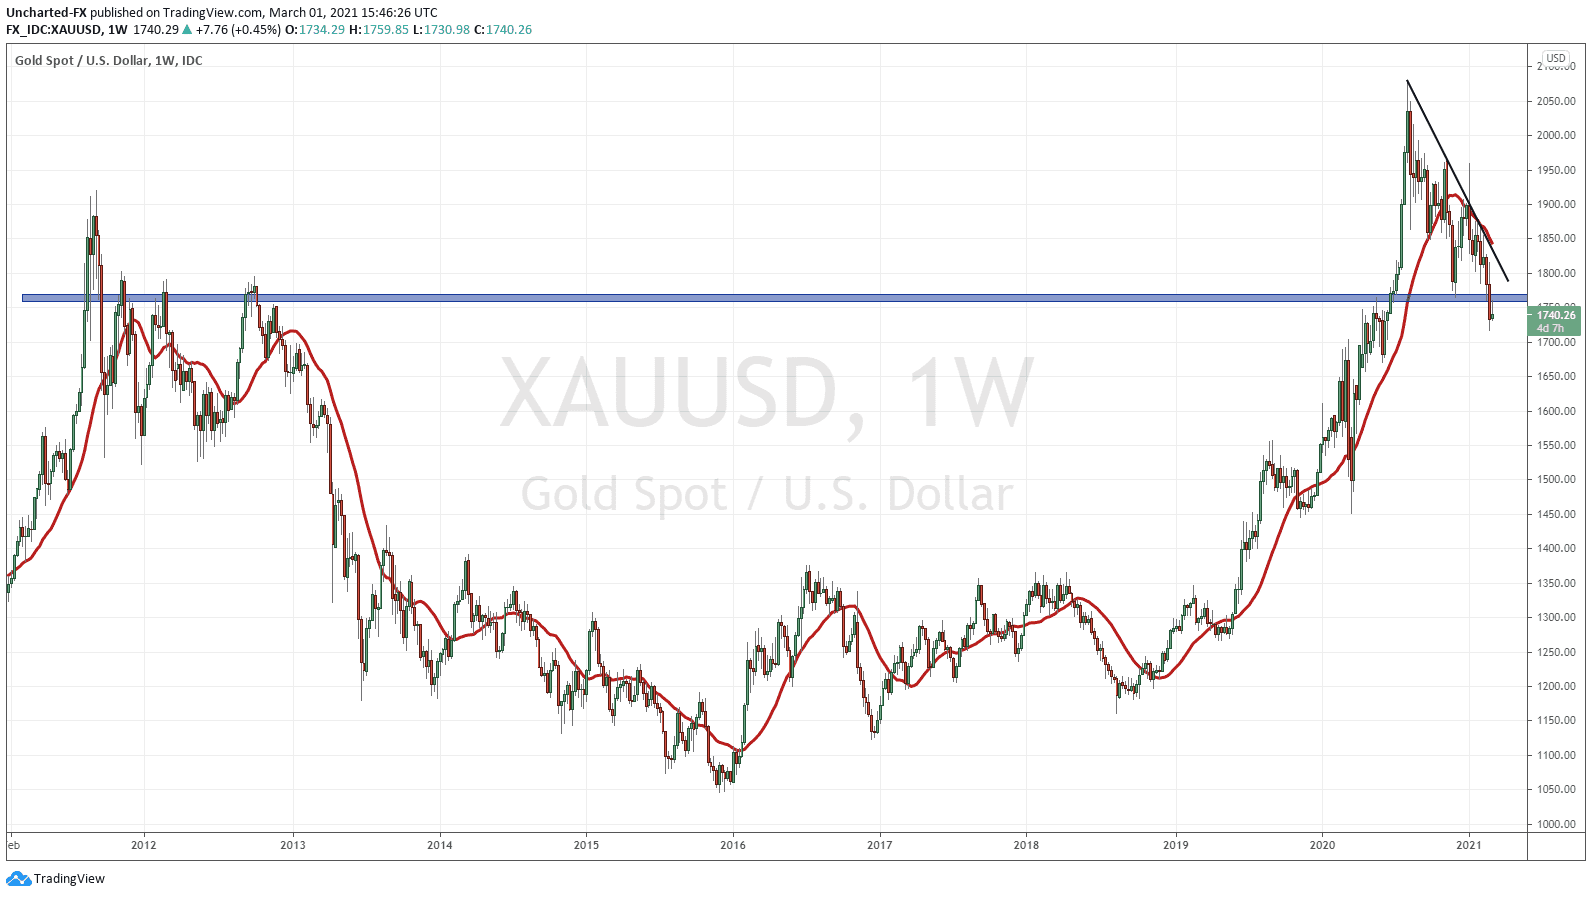
It is tough to be a Gold bull right now purely from a technical standpoint. Gold price closed down 2% and settled at $1732.53 on Friday. It then opened at $1734.29 during the Asian session and hit highs of $1759.85 before selling off during the European session. But this sell off happened at a KEY price point. Something we will cover in the Technical Tactics below.
Everyone on financial media is talking about the rising yields. Now of course if you are a longtime reader of Market Moment, or are a part of our Discord Trading Room (to join, click the Discord icon among our social media icons at the top of this page), then you would have been, excuse the pun, way ahead of the curve.
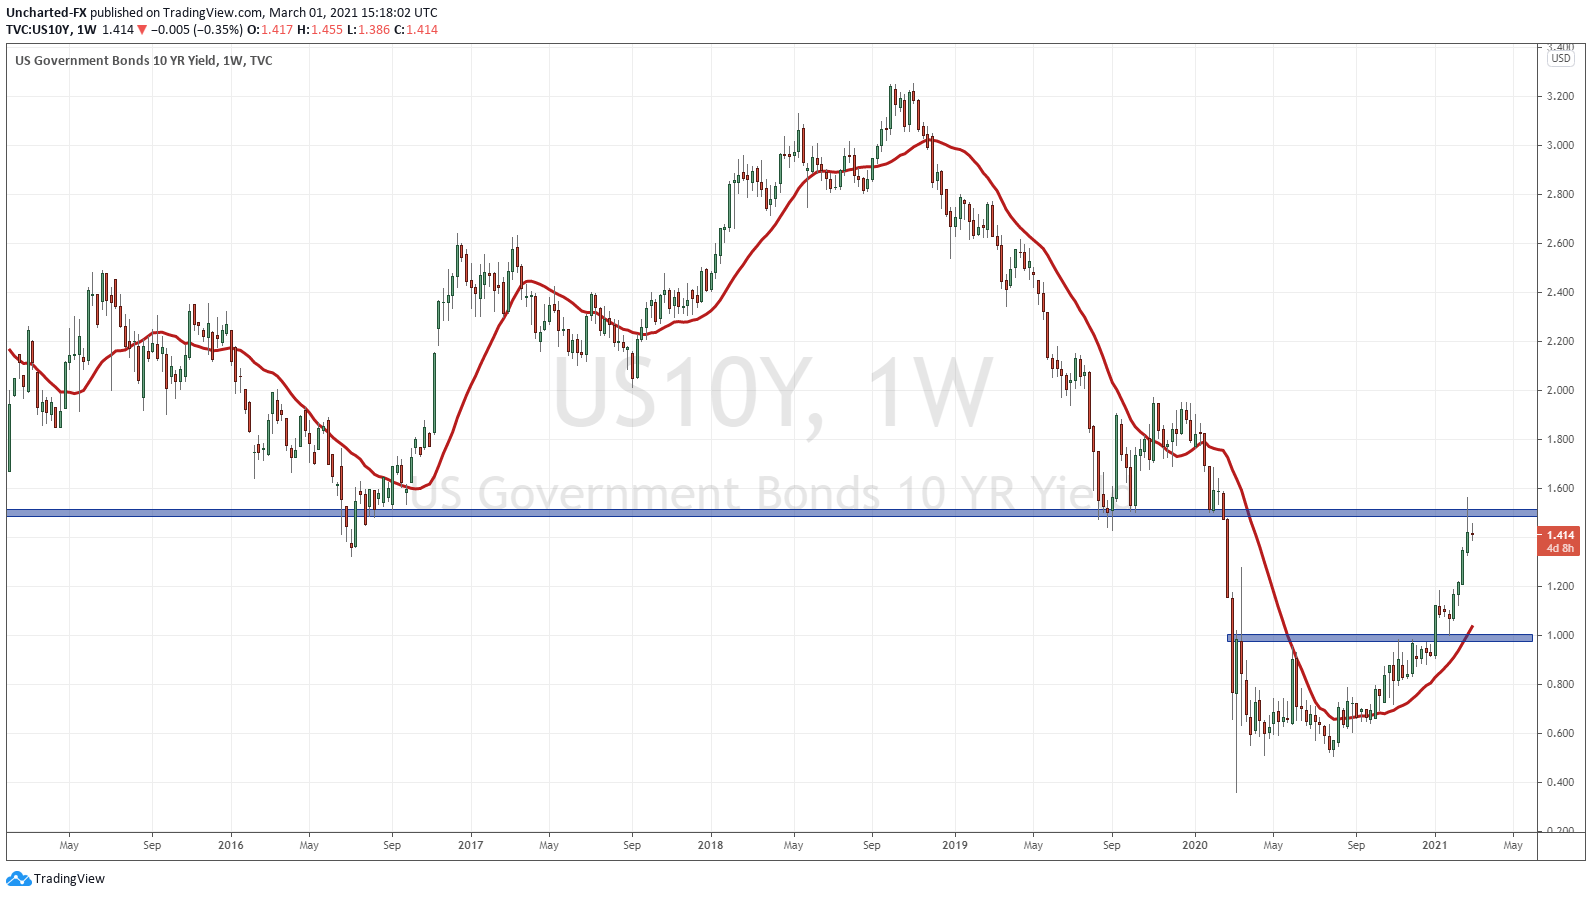
For one of my 2021 Outlook posts, I discussed how the weekly chart of the 10 year is very likely to hit 1.50%.
Well, we did it:
A quick summary on how we use the bond markets to determine where stocks are going:
When the 10 year yield spikes, we are seeing money leaving the safety of bonds (bonds being sold), and we generally expect this money to move into stocks. The whole risk on and risk off asset allocation model of managing money. When the 10 year yield drops, we are seeing money head into bonds (bonds being bought) which means money is leaving stocks and heading for the safety of bonds.
The Fed Fund Futures began pricing in a Federal Reserve interest rate hike sometime this year due to inflation concerns. Last week, Fed chair Powell did his best to ease rate hike fears by saying Inflation is nowhere near our targets, and rates will not be going up anytime soon. We shall see if the markets buy it.
So when we see a situation where the 10 year yield is spiking, and money is NOT heading into stocks, but in a safe haven asset such as the US Dollar, the market is spooked. This is what we had last week on the sell off.
One can also argue that because of the debt in the system that is out there, the Fed cannot raise interest rates. Remember: the 10 year is the basis for loans and mortgages in the US.
Looking back at our weekly chart of the 10 year yield, we saw a weekly close below 1.50%. This is the start of a good sign. All week we will be watching the 10 year yield and the Dollar. We want to see this yield drop or remain stable. The same goes for the US Dollar. If we see this, then the Stock Markets will recover and remain in their uptrend. If we see the yield begin to inch higher, then Stock Markets will have another leg lower.
But let us think two steps ahead. Most of us know what is coming. Yield Curve Control.
This has essentially been occurring on and off (but some believe mostly on) since 2008 under what is called Quantitative Easing. Where the Central Bank buys bonds to suppress interest rates and inject new money into the system.
But here is the Investopedia definition:
Yield curve control (YCC) involves targeting a longer-term interest rate by a central bank, then buying or selling as many bonds as necessary to hit that rate target. This approach is dramatically different from the Federal Reserve’s typical way of managing U.S. economic growth and inflation, which is by setting a key short-term interest rate, the federal funds rate.
It can be summarized as manipulation of the bond market. Many expect the Fed could announce this at their next FOMC meeting in mid March, if the 10 year continues higher. Some say it is already occurring and will be officially announced mid March. Whatever the case, just know that the Fed will likely keep interest rates suppressed. They know the chaos that would ensue if rates were to go out of control with all this debt in the system.
Now we come to Gold. Because the precious metal pays no interest, it does well in a low interest rate environment. This was Ray Dalio’s bullish case for Gold. Bonds are yielding next to nothing, we expect rates to continue lower, Gold then becomes the better safe haven. With this rise in rates, Gold has really felt the pain, and we have broken and close below a major support level.
Technical Tactics
Readers will recall the 2021 Outlook for Gold. We wanted to see the weekly support hold above the $1750 zone. Gold failed to do so.
Bearish Scenario for Gold Price
Gold price closed below our major support on the weekly chart. The $1760 zone is now acting as resistance (price ceiling) and we did see Gold retest this zone during the European session. The sellers stepped in, indicating more downside pressure is incoming.
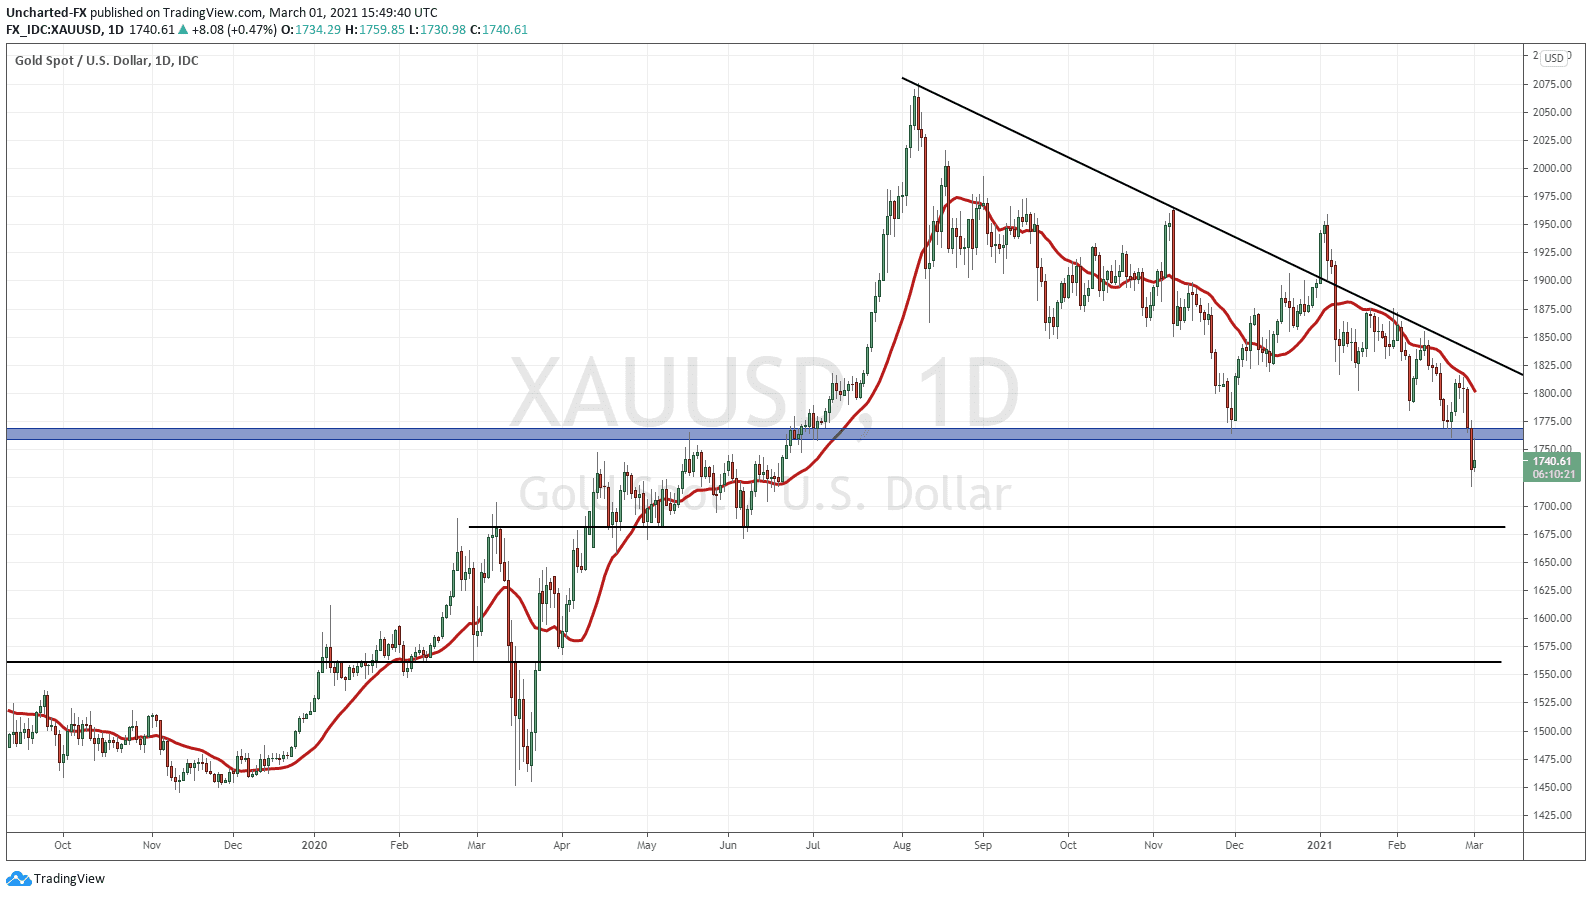
Going down to the daily chart, and we can see some support levels to work with. Remember, we like flip zones, or areas that have been BOTH support and resistance in the past. These flip zones attract price like a magnet.
The next targets to the downside include the $1680 zone and if that breaks, we can possibly make a drop all the way down to the $1550 zone.
Bullish Scenario for Gold Price
The bullish scenario has already been alluded to.
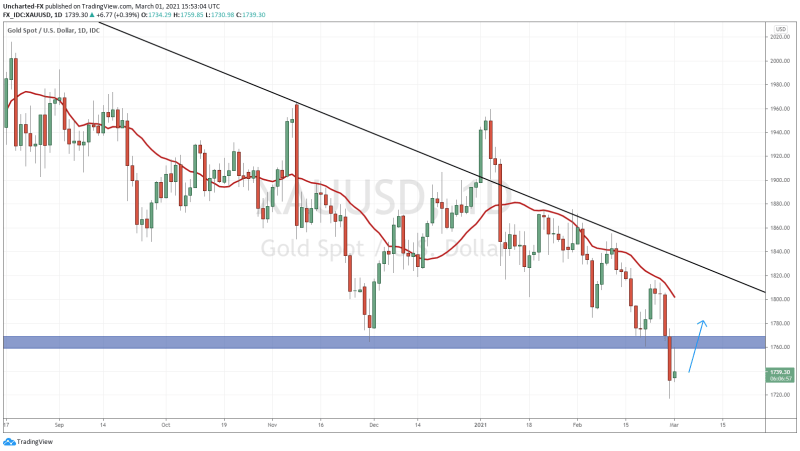
Zooming in on our daily chart, mainly so I can show you the daily wick rejecting $1760 and thus the importance of this zone.
If we can get a daily candle close back above $1760, we would nullify the breakdown. For further sign of a fakeout breakdown, we would want to see our weekly candle close on Friday back above $1760 as well.
In summary, all eyes will be on the 10 year yield, and rightly so. The Stock Market wants lower yields. So do the Gold bulls. It is very likely that bonds will be bought up under yield curve control, and we should expect to hear this from the Fed and Financial media at some point. Can we even hike interest rates now due to the amount of debt? Are we just like Japan and Europe who cannot hike rates? Is it more likely we go into negative territory than hiking interest rates? All important questions to ponder.

