A lot has been said about Copper and Oil. Both commodities took a major hit last year on the pandemic everything sell off. Oil famously going to zero and negative territory. While Copper went slightly below $2.00 per pound.
What a turn around.
Both commodities have know made up all their major sell off losses, and have broken out into new territory.
Let’s take a look at the technical chart for Oil and Copper and compare them.
Your eyes should pick up some similarities, and we will discuss the fundamentals in a bit, but first, let’s break down the technicals.
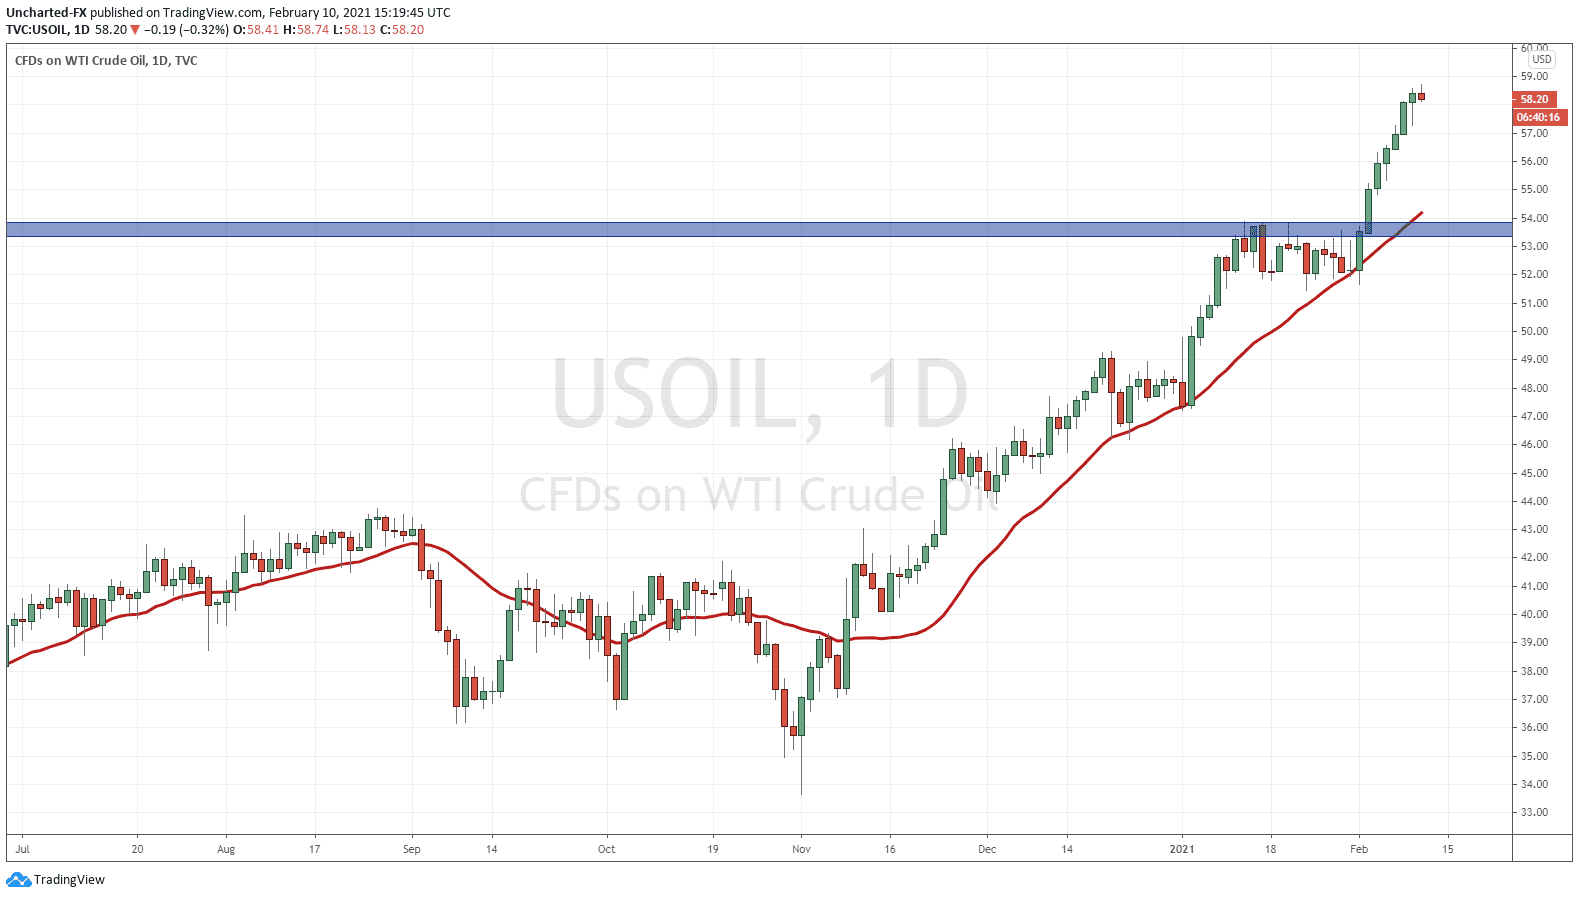
Members of our Discord Trading Room recall my warning on Oil. Oil prices began ranging at a previous resistance zone at $54.00. This price zone added further importance because it was where the February 2020 sell off began!
I am not one who likes to play the bottom and upper limits of a range. I prefer to await the breakout or breakdown. It might take days or weeks, but we must remain patient. Oil indeed broke out, and has not pulled back to retest the $54.00 breakout zone. It has just climbed, and gained close to 10% on the break. Oil has been very strong.
Technical Break Down and Price Target
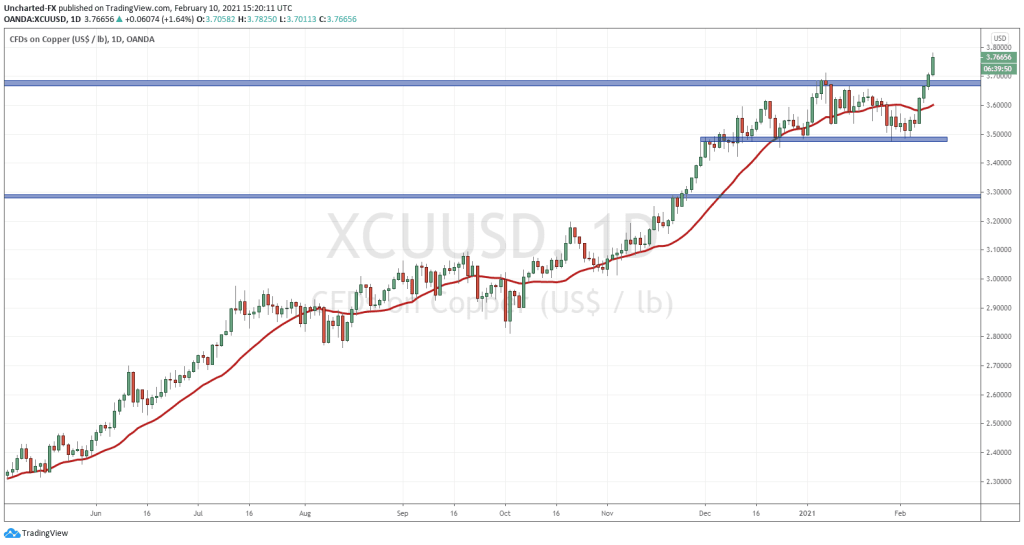
To be completely honest, I was looking for a reversal on Copper! When Copper prices hit this resistance at the $3.70 zone, we were seeing signs of a head and shoulders reversal pattern, and the US Dollar was showing some strength. Once again, the trigger for our patterns are the confirmed breaks. Since that did not happen, we did not take a short.
The opposite of what I was expecting happened. We broke out higher! Yesterday confirmed the breakout with a daily candle close above $3.70, and as long as this zone is held, we should expect further upside targets.
The next price target you ask? Moving to my weekly candle charts, I do not see resistance until we hit the $4.00 zone (3.90-4.00). That is my next target.
The fundamentals for these moves in Oil and Copper have been stated as the recovery trade. In the past, I have said that Oil is the vaccine play. Airfare demand when people are allowed to travel again will surprise many analysts.
Both commodities have also been tied in with China. The Chinese economy still carried on while most of the Western world was locked down. It is very likely China stockpiled some Oil and Copper at very cheap prices. Copper is known as Dr. Copper because it is used to gauge the health of the economy. If countries are building infrastructure, they will need Copper.
“Inventories are still quite low on exchanges. That gives good indication that manufacturing demand for copper is present and that its not just a speculative story,” Nitesh Shah, an analyst at investment manager WisdomTree, told Reuters.
In China, the world’s top consumer, copper inventories normally accumulate in the run up to the Lunar New Year as businesses close for the week-long festivities.
But this year, Chinese inventories have dropped to near decade lows on robust demand from factories, which are maintaining high operating rates due to shortened shutdown periods and tighter travel restrictions for workers.
Copper’s 8 year highs are now being attributed to the US side. US stimulus hopes are driving recent price action.
What many people are realizing about Copper is that it will be the green energy metal. We will need more Copper not only for Electric Vehicles, but for the ‘electrification’ of the grid. President Biden’s green energy plan, but also the green energy plans by many governments, will be a major upcoming catalyst for Copper. This will be the way I play the large green government infrastructure projects.


