Take a look at my previous take on Gold for 2021, and why we are in for a potential 180% plus move in the yellow metal. That Market Moment post from last week puts a lot of things together, and will be referred to in this mornings Market Moment.
This move in Gold is not coming in a month or two, the last time the fundamentals and the technicals aligned like this, it took 400 plus days for the completion of this 180% move. We are in Gold for the long term as the confidence crisis in government, central banks and the fiat currency intensifies.
My readers are familiar with the cheap and easy money. Interest rates are not going higher anytime soon. In fact, one can argue they can never rise due to all the debt that needs to be serviced. Hikes into negative territory is more likely going forward…and to be honest, is pretty much a guarantee.
Government fiscal policy is going to increase, especially if the Democrats take the Senate (will be split but the VP gets the deciding vote). This covers the confidence crisis in central banks and the fiat money. The confidence crisis for government is playing out: regardless of who wins the next election, neither side will accept the result. This division will continue.
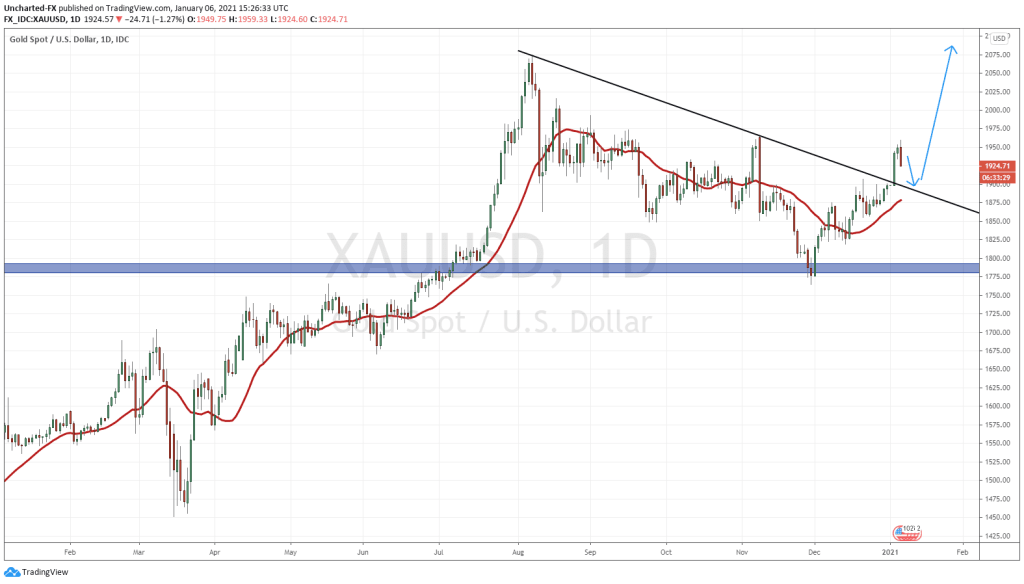
Heading back to my last piece on Gold, I outlined the fundamentals and technicals going forward. If you read that piece, an entry trigger was the close above this triangle/ trendline pattern. Ideally, by the end of the week, we get our weekly candle close confirming this. But as of now, we do have a DAILY candle trigger.
As you can see, the price of Gold broke above 1900 and confirmed a triangle/ trendline close. Love it. To me, this is an opportunity to go long for a trade.
Remember: breakout and then retests are possible. In this case, price can pull back to retest the 1900 zone as it is an important psychological number. In terms of a trendline break , we want to cushion our stop loss below the daily break out candle. In this case, I would say that our long trade is valid as long as the daily candle of Gold does not CLOSE below 1885.
You all know my LONG term targets (posted in last weeks Market Moment), but if one just wanted to swing trade Gold , what are some targets to consider? New record highs in my opinion.
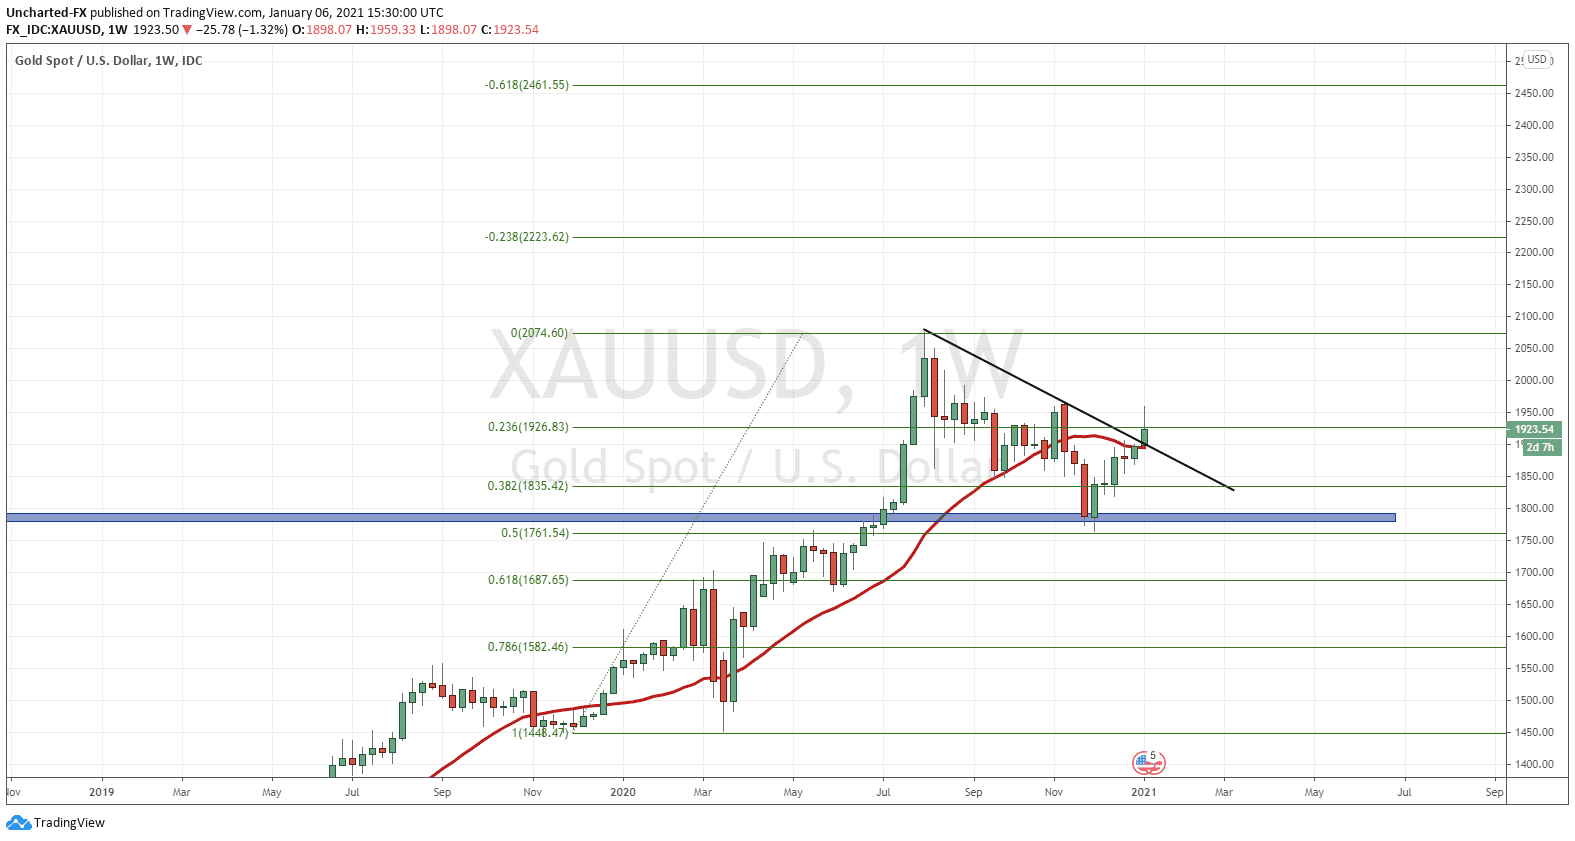
So what I did in the chart above, was to use the handy dandy fibonacci tool on the recent upwards wave on the weekly chart of Gold .
Looking at my fib, you can see price bounced at the 50 fib. Very nice. But we are all interested in the upward targets. The fib extensions as we call it. My fib targets for a TRADE would be 2223 and 2461 (let’s just use the 2500 zone). Once again, we probably won’t reach those targets on a straight pop, but expect some pullbacks on the way up there. Resistance at previously record highs at around 2080 is where we could see some profit taking and perhaps some sellers jump in. Expect a battle between the bulls and the bears at that level.
Once again, the macro picture is very positive for Gold .
A final word regarding the Senate run-off. If the Democrats win, many are expecting the stock markets to drop. So far, it has been confirmed that Warnock has won one seat, and media is reporting that Ossoff is leading, and the Democrats are set to take the Senate. The Nasdaq was impacted the most overnight on fears of regulations on tech companies. Other equity markets were also lower, but are so far recovering today.
A Democratic ‘Blue Wave’ will be positive for Gold and Silver. Since February of 2020 (our everything sell off), Gold has moved alongside the stock markets. This positive correlation might have some hiccups. but on most occasions, it remains intact. The key will be the divergence. This will eventually happen, and perhaps Democratic money spending is the trigger for this. Funnily enough, as I write this, Gold and Stocks are moving in opposite directions and not in unity.
Oh and one more thing…well two technically:
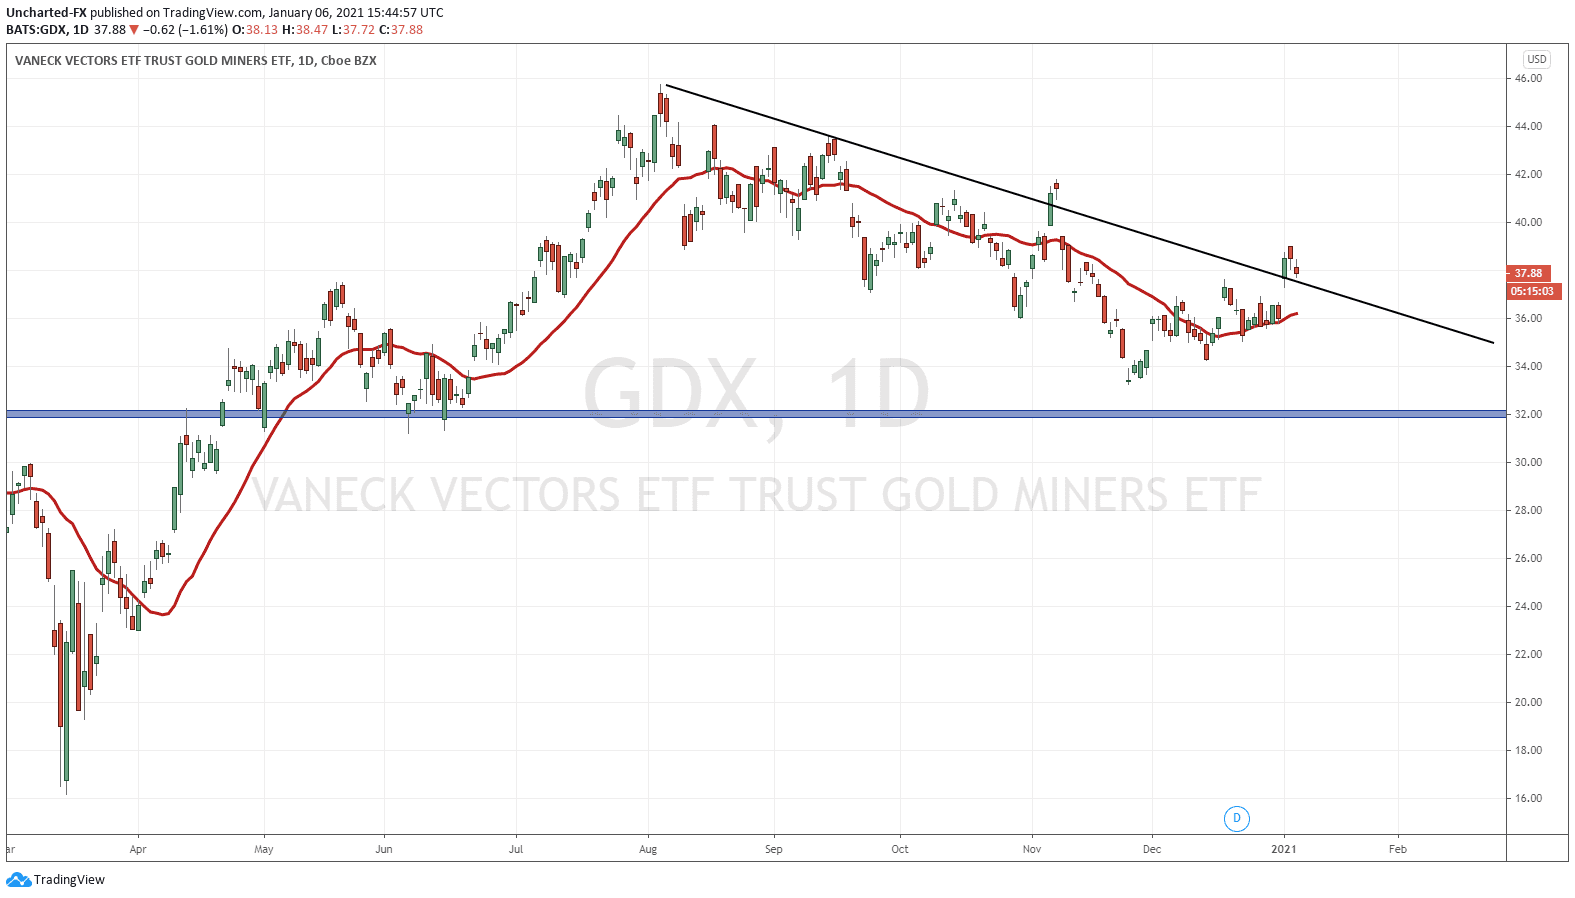
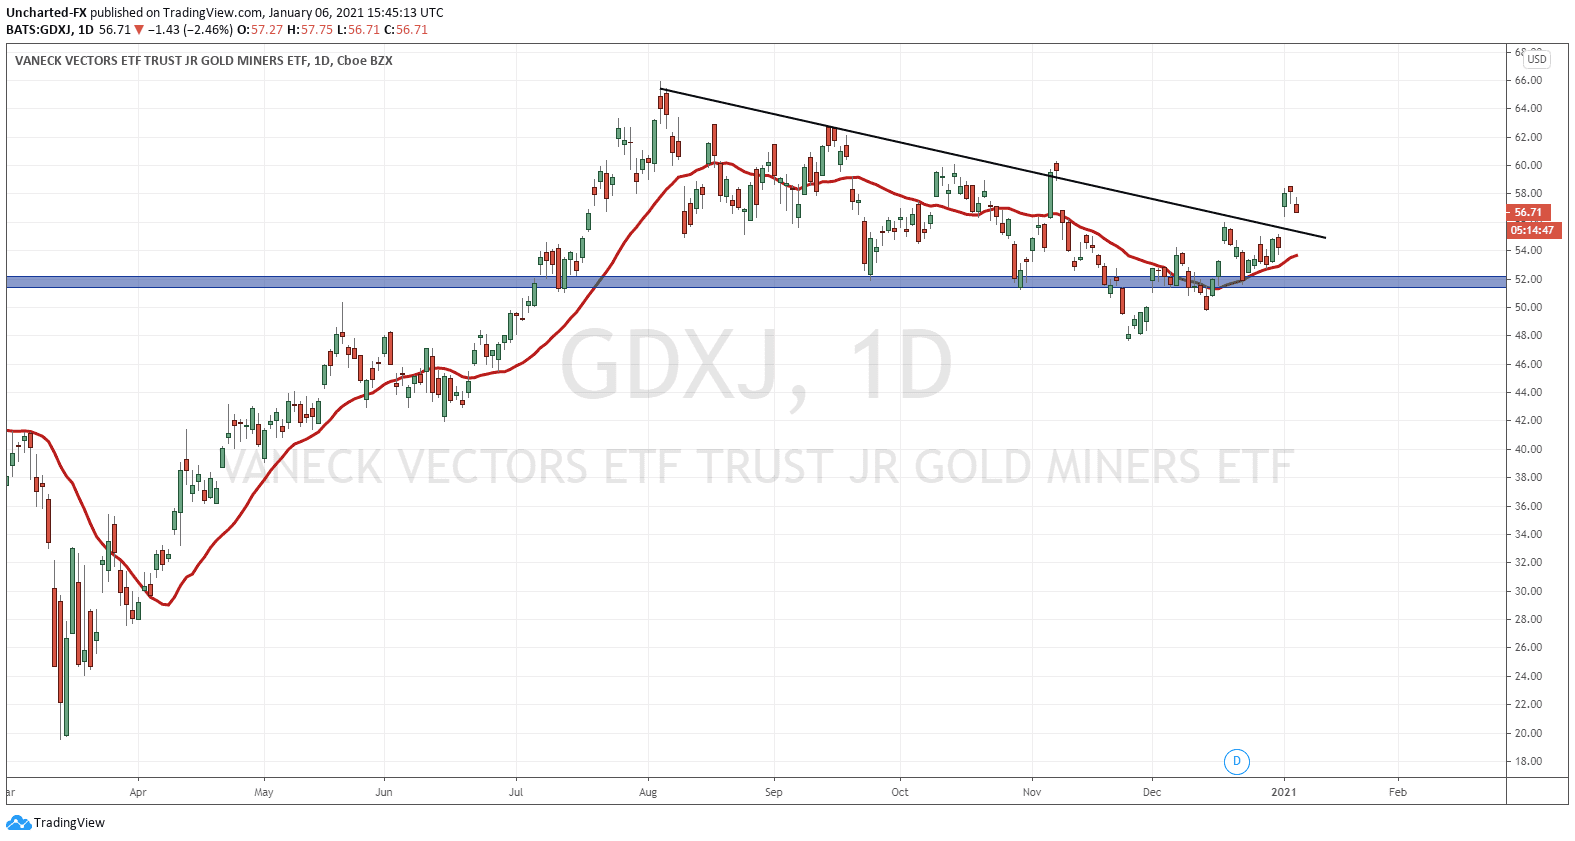
The GDX and the GDXJ have bounced at our large weekly support zones (which we broke out in April and June). Took us a few months to gain some momentum at this support, but this is why patience is key. The technicals held, so our long term trades remained valid. Trust the system and your analysis. There were some scary dips below support for the GDXJ , but we reversed (faked out) and climbed back above.
Most of you probably see what I see. Both the GDX and the GDXJ have the same sort of triangle/ trendline pattern, although some would say this is a pennant / flag pattern. Regardless, the trendline break indicates a momentum shift.
Very exciting times going forward for the Gold market. In summary, a trade is triggered, but for the longer term move as mentioned in my past post, we would want to see a WEEKLY close above the triangle on the this Friday’s close.
Expect a pullback (like we are seeing NOW) and this is welcomed because it would meet our criteria for market structure. This pullback can take us back to our trendline break , and we want to see price remain above 1885 on the candle close. We will be watching this over on the Equity Guru Discord Trading Room.

