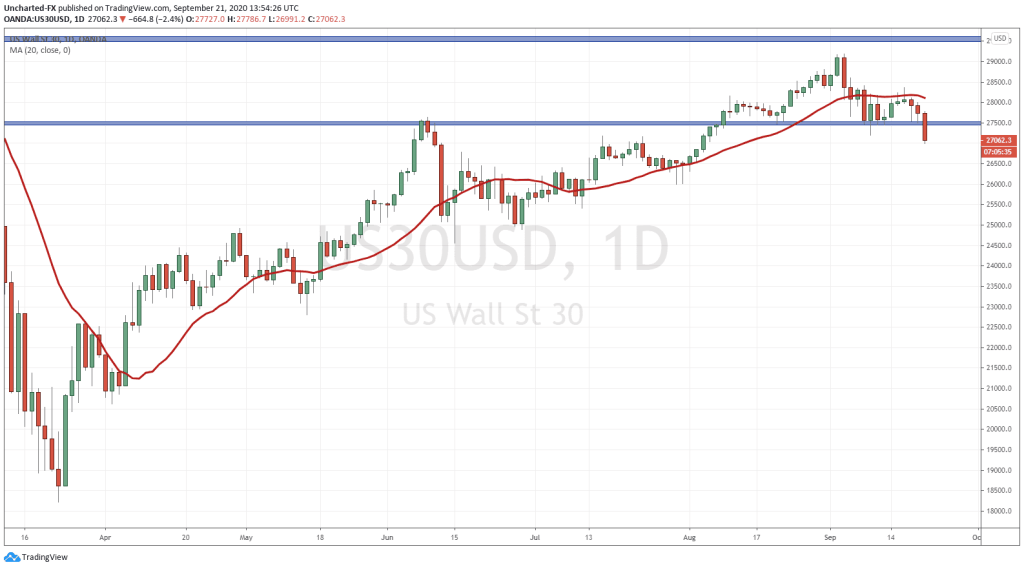
Wow. Buckle up folks. Today will be a crazy day for the markets. Initially, I was going to be writing about how the Stock Markets are all at major support, and this week will be crucial to see if they can remain above major support. Well, as of now, we are looking likely to close below major support to trigger more selling. That is unless something comes out which will cause markets to react the opposite way, or money managers buy these dips because one thing has note changed: stock markets remain the place to go for yield.
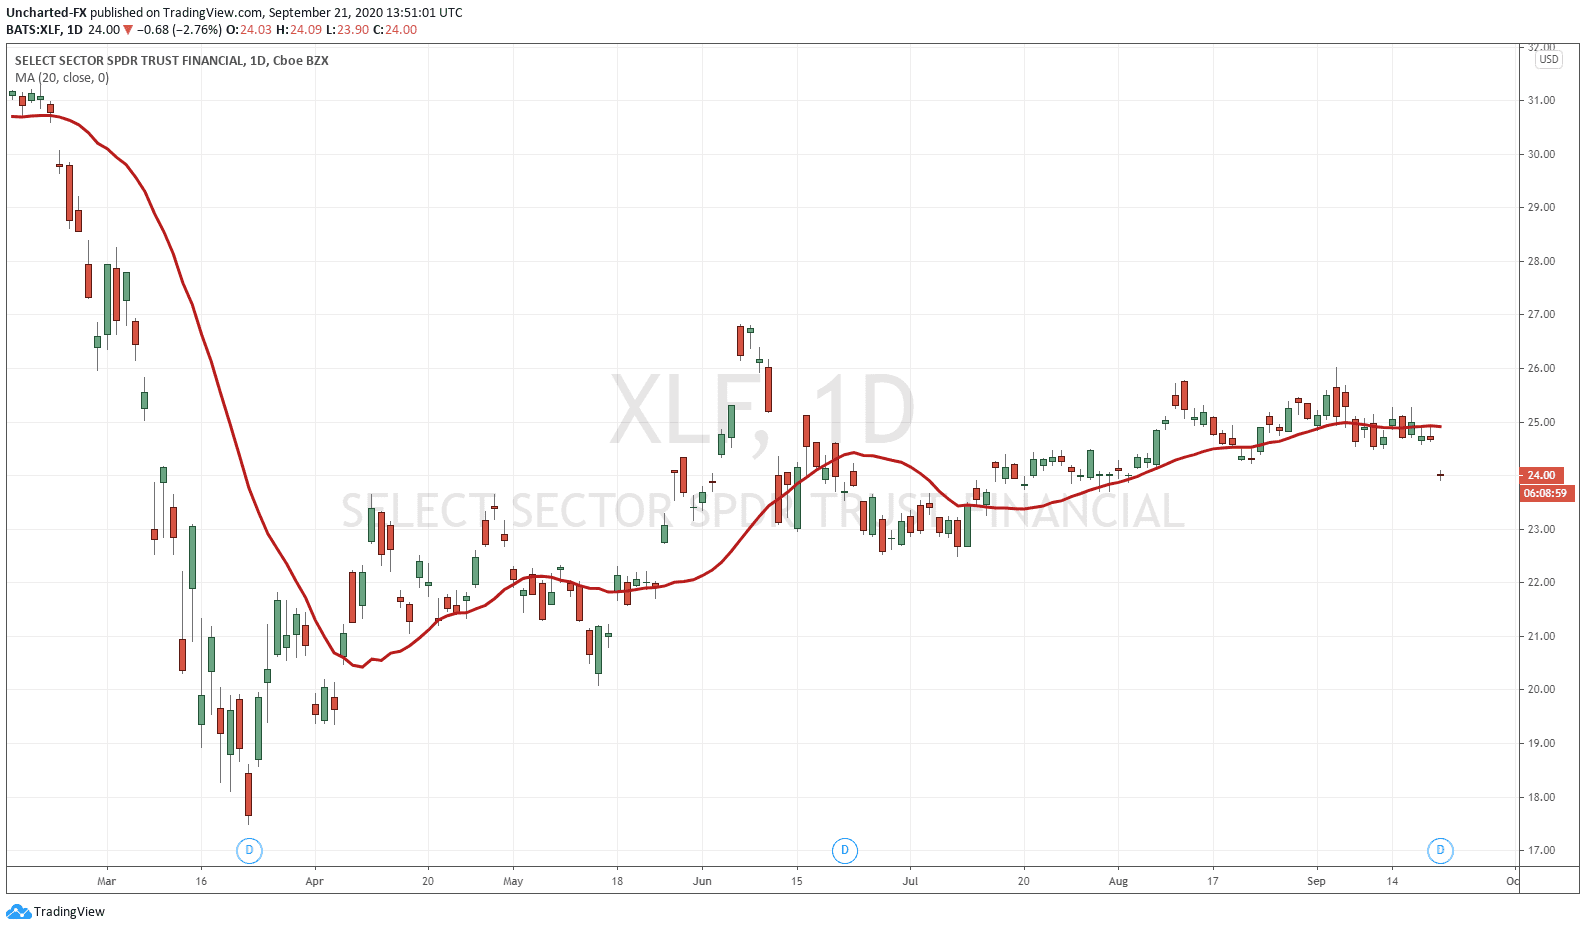
So what is the big change? The Bank stocks. News came out this morning implicating major banks in a wide-spread money laundering scheme.
Nobody was expecting this. US bank stocks have taken a hit…and I mean big time.
Big gap down in all the major US banks and it is impacting the markets with a big opening red candle, and equities hitting below 2% within the first 20 minutes of trading.
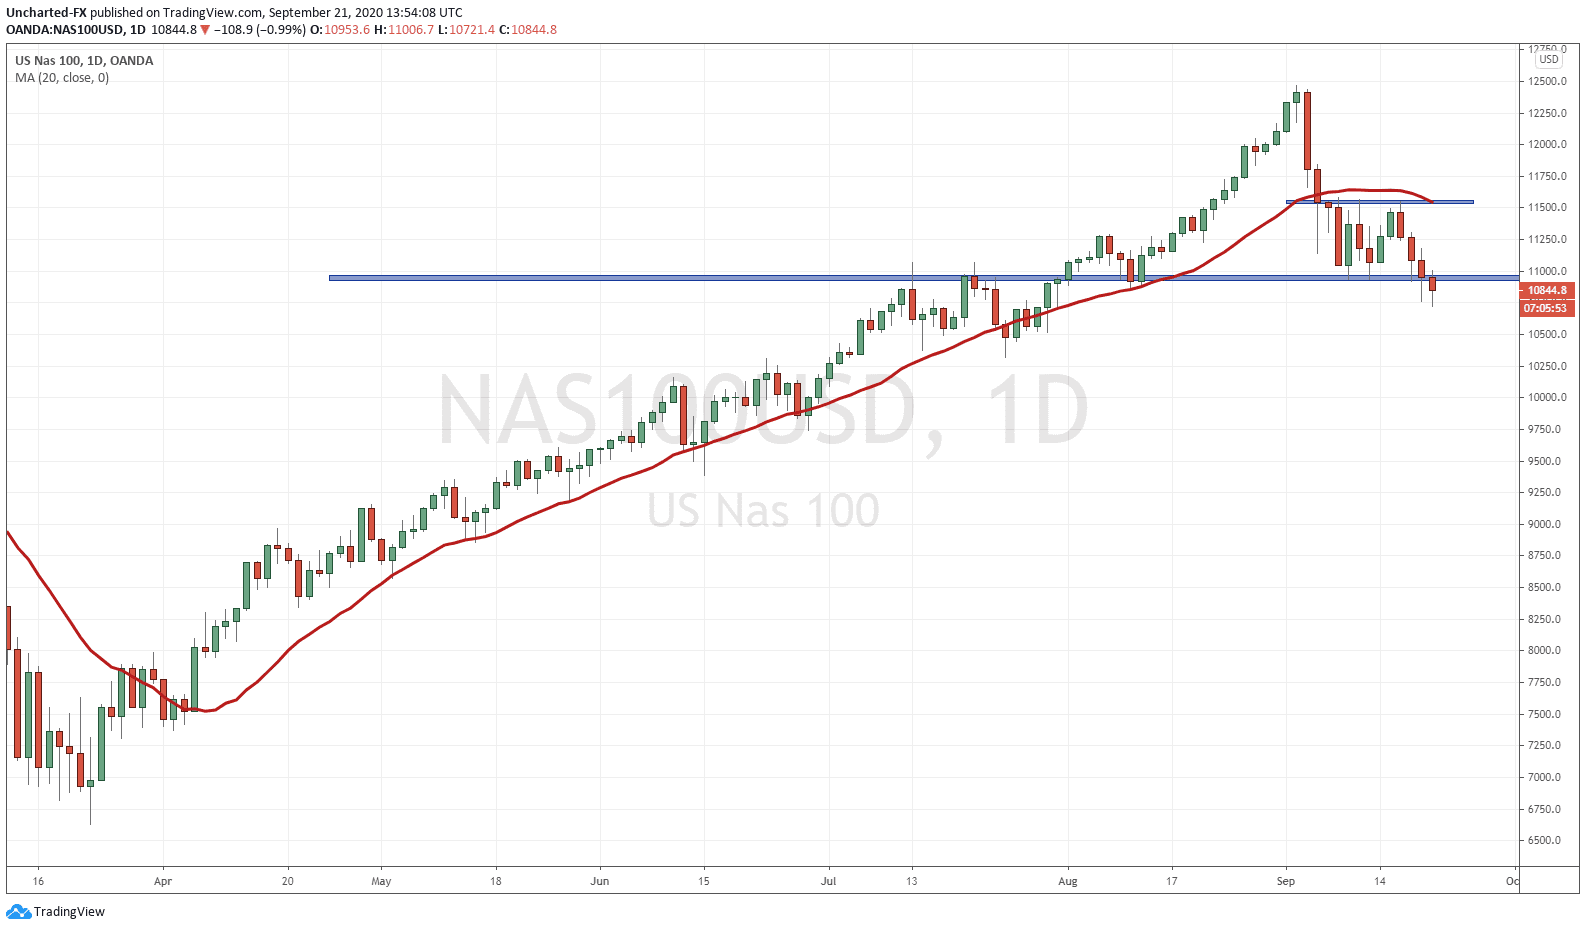
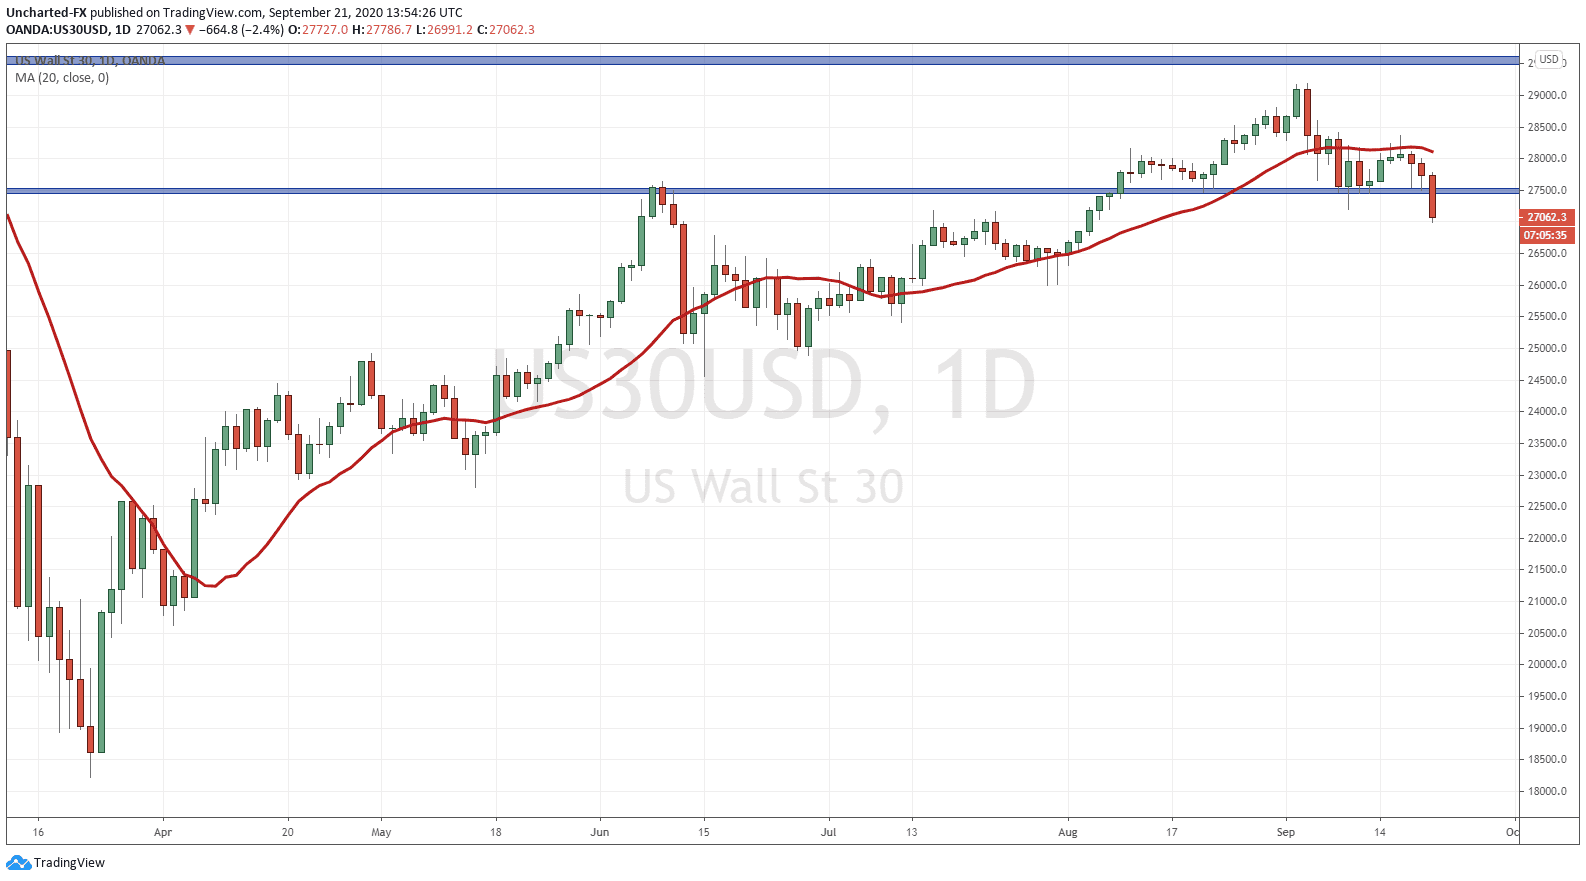
Let me remind you of the equity levels I have been watching since last week. Just note that the daily charts are currently reflecting today’s price action.
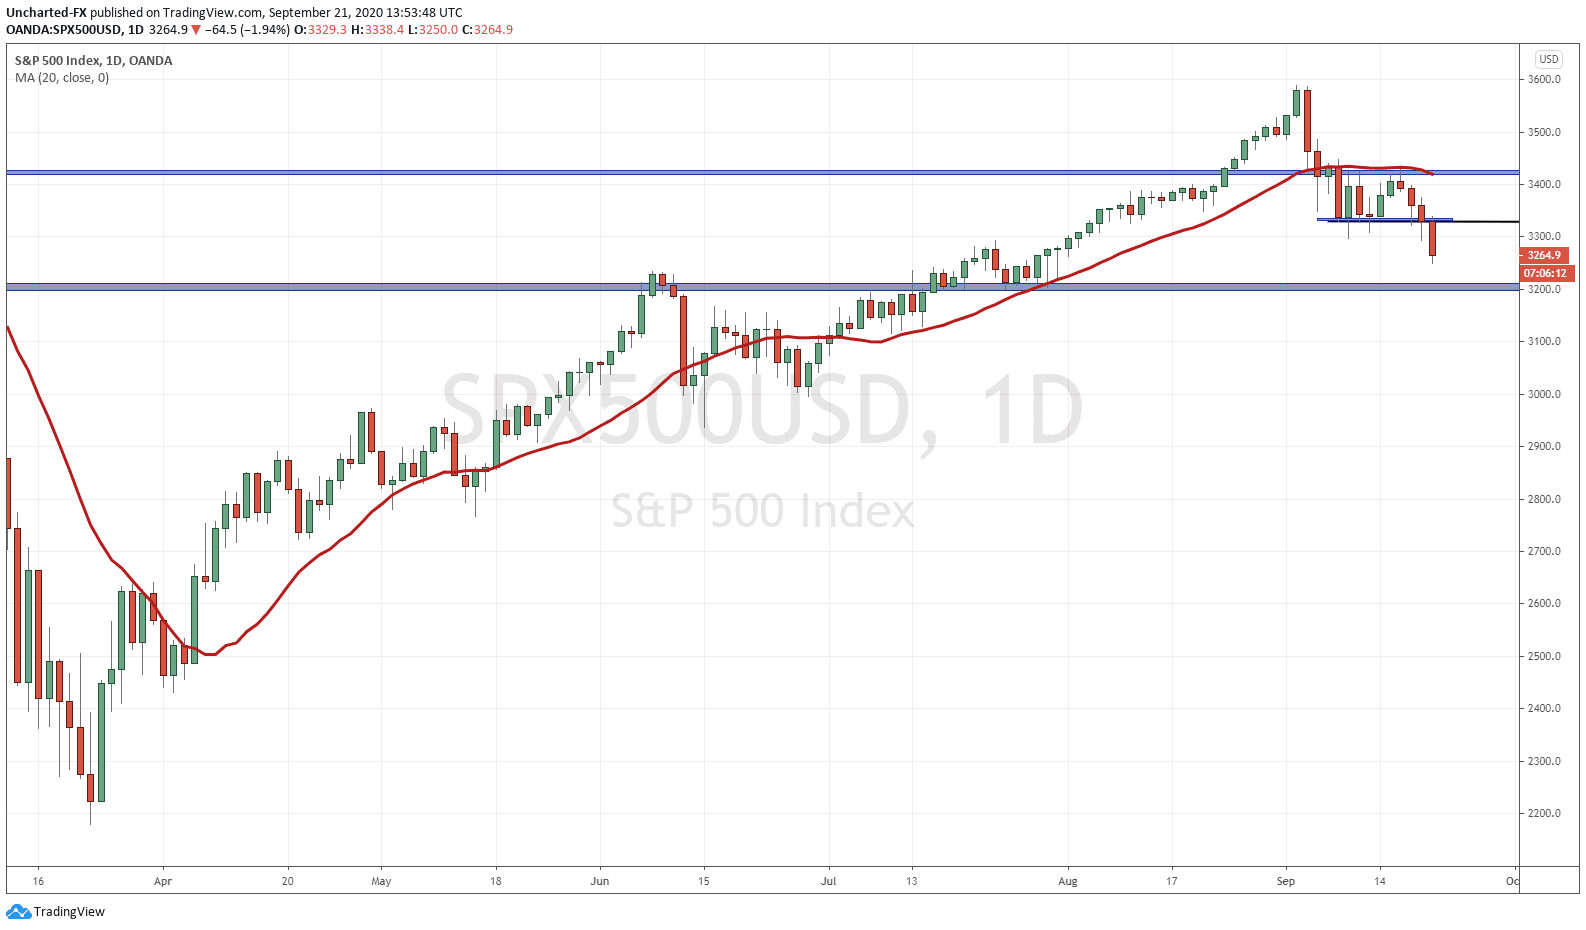 The S&P 500 gave us a tease close on Friday, price did not close below our lower lows. However, as you can see from today’s daily candle close…we are on route to get that daily close today. If this occurs, I would target the next support zone at the 3200. Watch the 4 hour charts for a possible re-entry if the market pulls back before a sell off.
The Nasdaq also did not give us the close we were looking for on Friday, but also dropped this morning. However, the bids have been coming in at time of writing. Stocks like Apple, Tesla and Netflix remain green. Apple of course being a key component, and has a large impact on market moves these past few weeks. Further downside targets include the 10,000 zone.
Finally, and the chart that I am watching closely at, is the Dow Jones. I am more inclined to go short the Dow because it has a pattern that I can work with. That pattern is our head and shoulders reversal pattern. It is generally a topping pattern, and we can clearly see that pattern here. Some may argue there is a head and shoulders on the Nasdaq, and I can see that as well. But the pattern on the Dow is much more clear and defined. It looks much cleaner.
What will be my trigger to go short? I want to see the daily candle close below these levels. That is just me. How I trade. I await the breaks to confirms the short sell. In my many years of trading, I have seen price reverse as traders chase one side, only to see them incur large losses. This means that I may miss on some of the move, but the break confirmation actually increases the probability of my trade, and as many of my followers and readers know, trading is really the business of probabilities.
With a close below, I will then take a trade with a 1:2 minimum risk vs reward ratio, targeting a price of 26,000.
But I repeat, I will await that trigger.
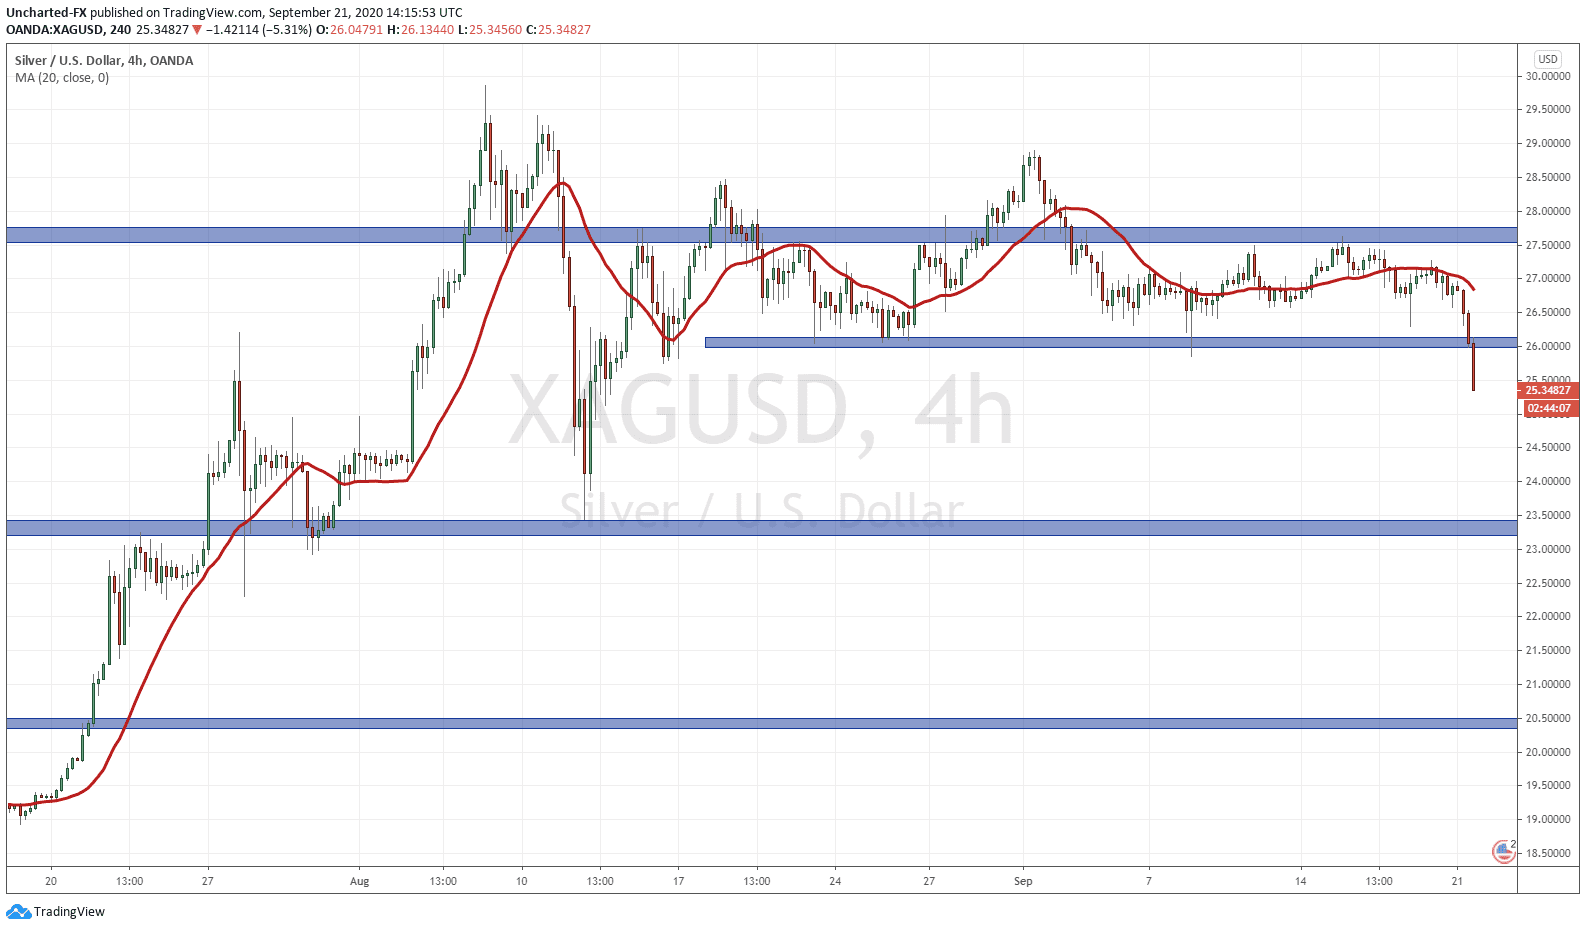
Also want to remind my readers of two other charts that are triggering. Gold and Silver are getting hit, and Silver has broken below our support zone which will trigger my short and a possible move down to 20.50.
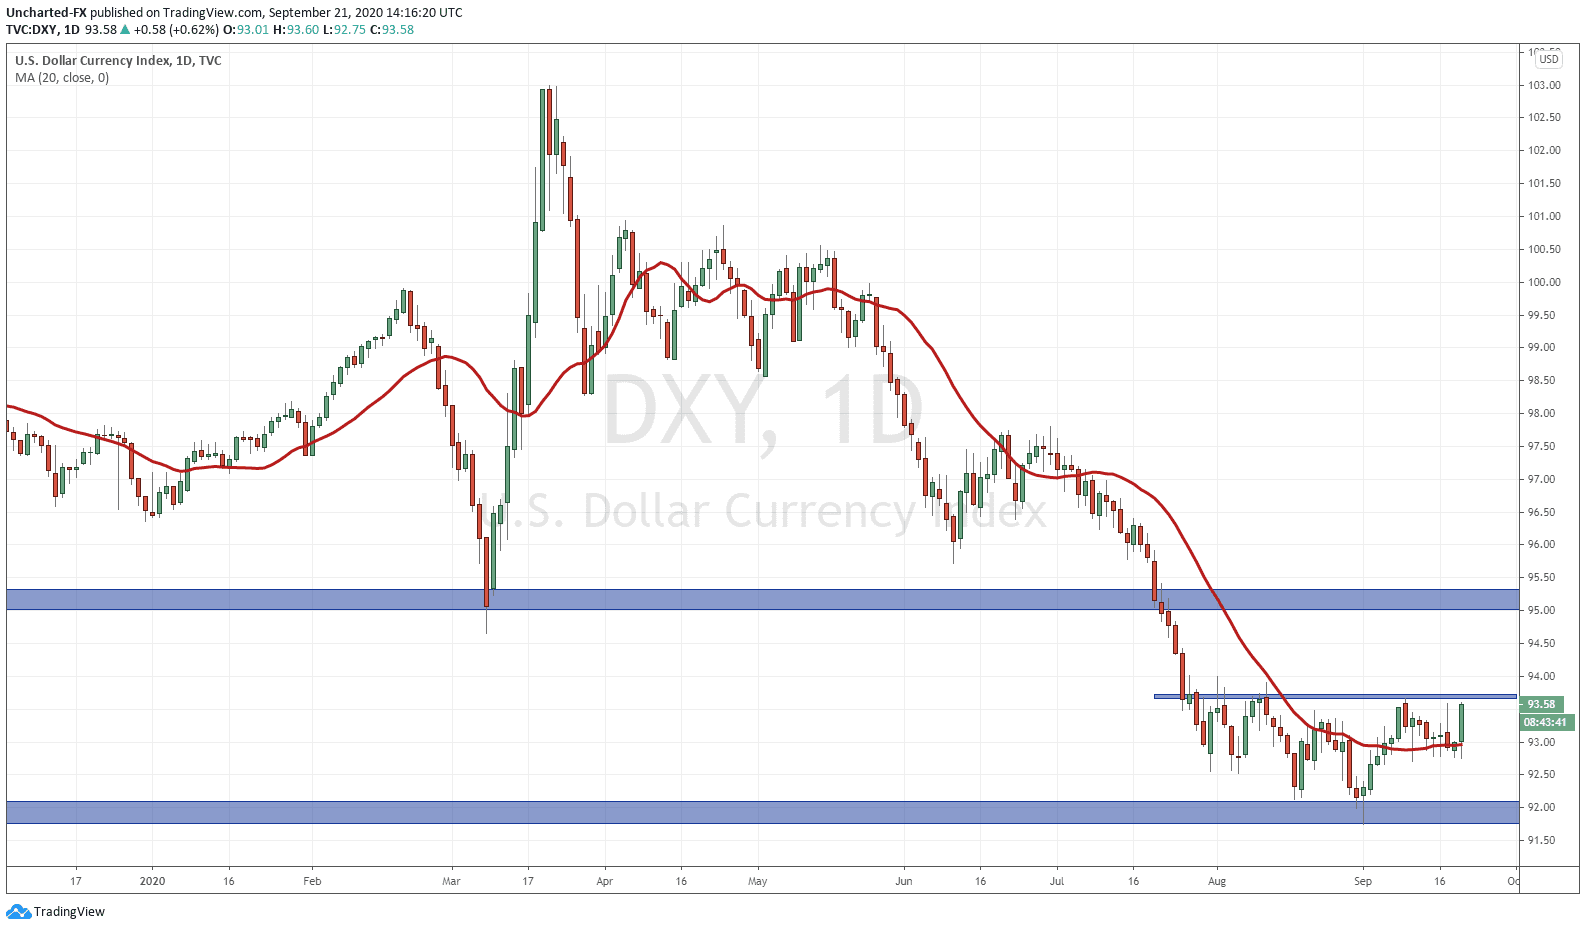
And finally, the chart that I have been watching for the past few weeks. The US Dollar.
Regardless of all the money printing and inflation rhetoric of the Fed, the DXY has been showing signs of a reversal. Telling us that all the fears of inflation have been priced in the move. I wrote about a possible bullish case in the US Dollar being foreign money. Foreign money buying dollars to buy US stocks, which would see both the Dollar and stocks move up together. This does not seem to be the case as of now, and I must say that now I believe this scenario is more likely to play out AFTER the US elections. Not really worth it for a foreign money manager to jump in knowing there will be a lot of volatility and uncertainty.
For now, a higher move in the Dollar would mean money running into safety. This confirmed breakout on the Dollar would mean more downside for equities…and more downside for Gold and Silver.

