Trade ideas and market discussion can be found on our Public Discord Channel: https://discord.gg/akcgCVP
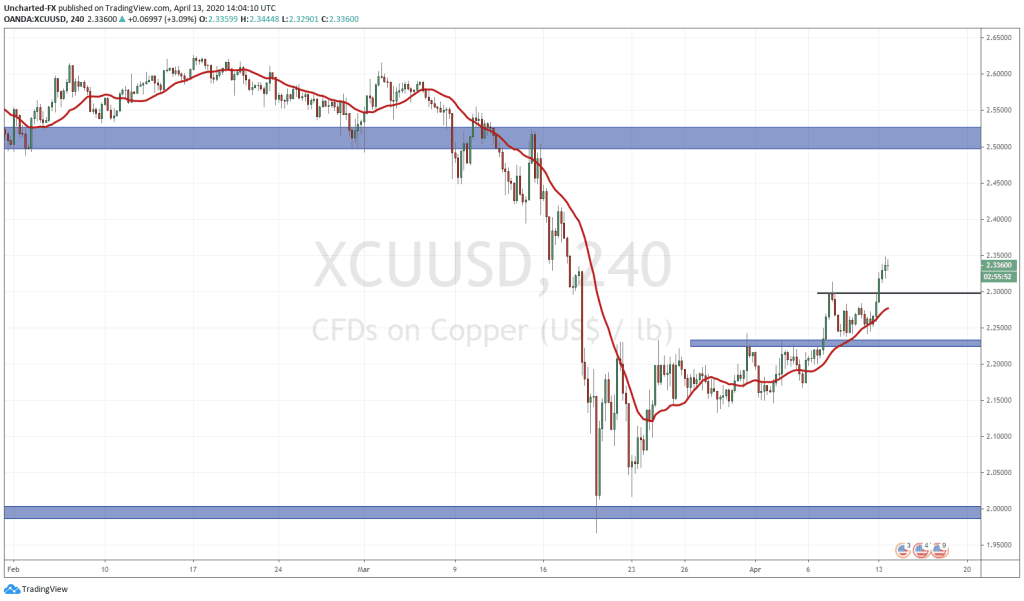
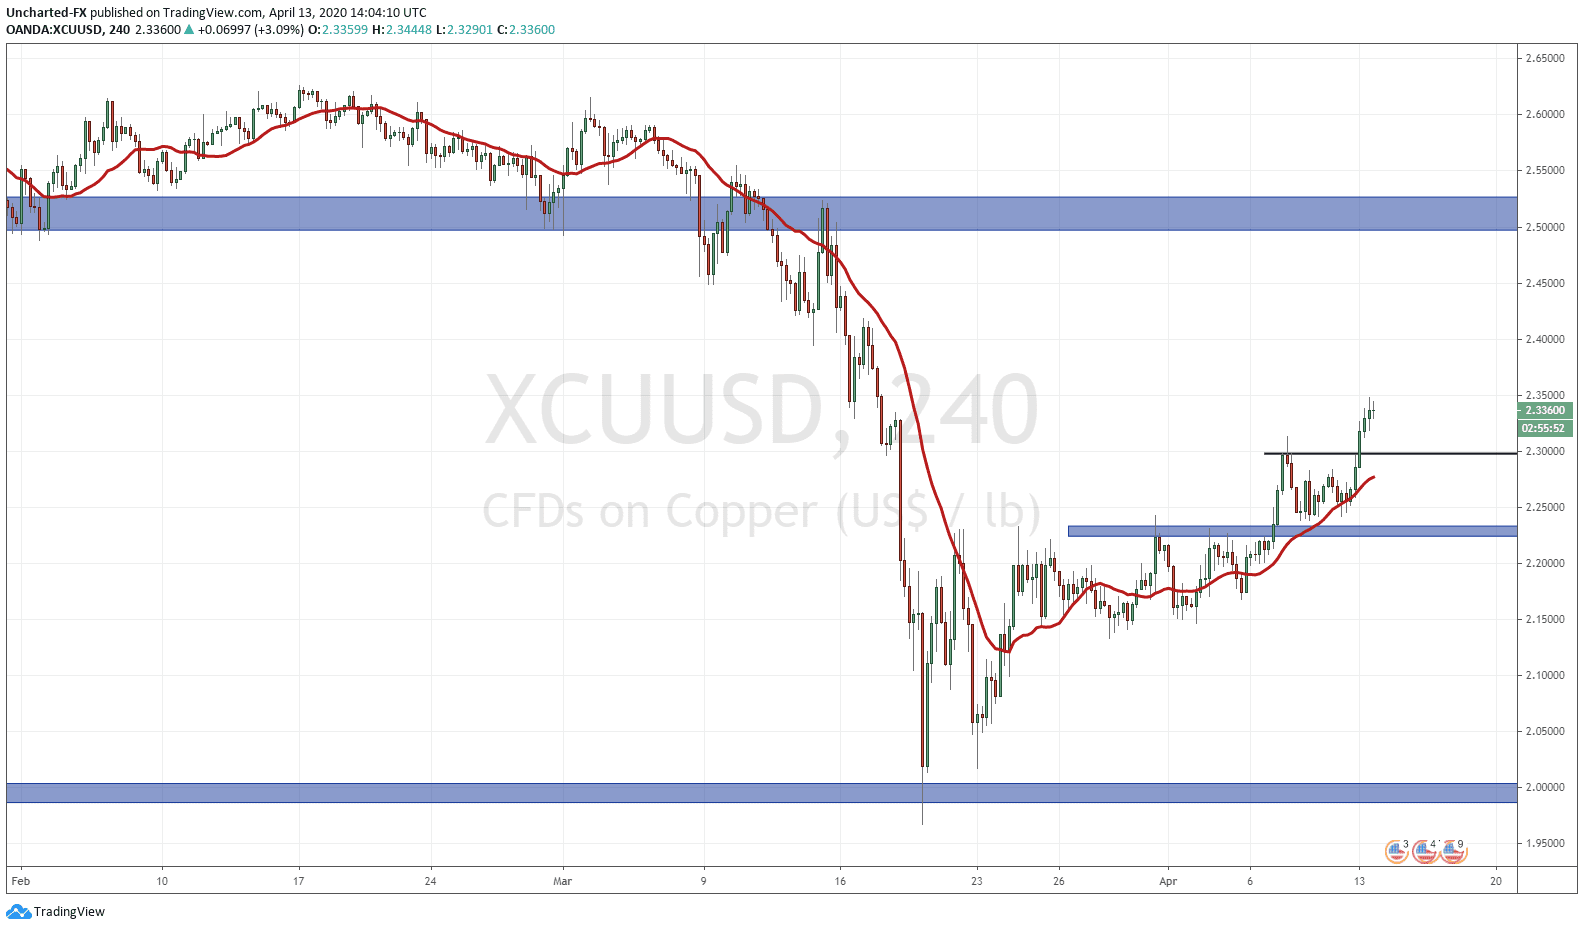
Copper has been a trade that we have been watching on the Discord chat for the past two weeks. We spoke about the price squeeze with copper hitting $2.00 a pound, and how many producers were barely making money, if any. Last week, copper gave us the break out we were looking for, but the follow through was not as ideal as I hoped. The price of copper continued to range after breaking out until the end of the week. For us traders to re-enter the trade, or add to our positions, we wanted to see a higher low swing confirmed. This is usually seen with a retest of the break out zone before breaking above previous recent highs. As markets opened in Asia on Sunday, we got that break higher and have now confirmed a higher low swing at 2.23. As long as we remain above this price, we are technically in an uptrend.
The question is, for how long? If economies continue to remain closed, the chance of a recession, or as many others say, a depression, become really high. This is of course negative to “Dr. Copper” which is an industrial metal that is used for construction and other things which give us a sense of global economic health. China was the big copper buyer, accounting for over 50% of copper’s demand. Once again, is all this already priced into copper? I trade the charts that I see, and so far, this breakout is tradeable to higher levels.
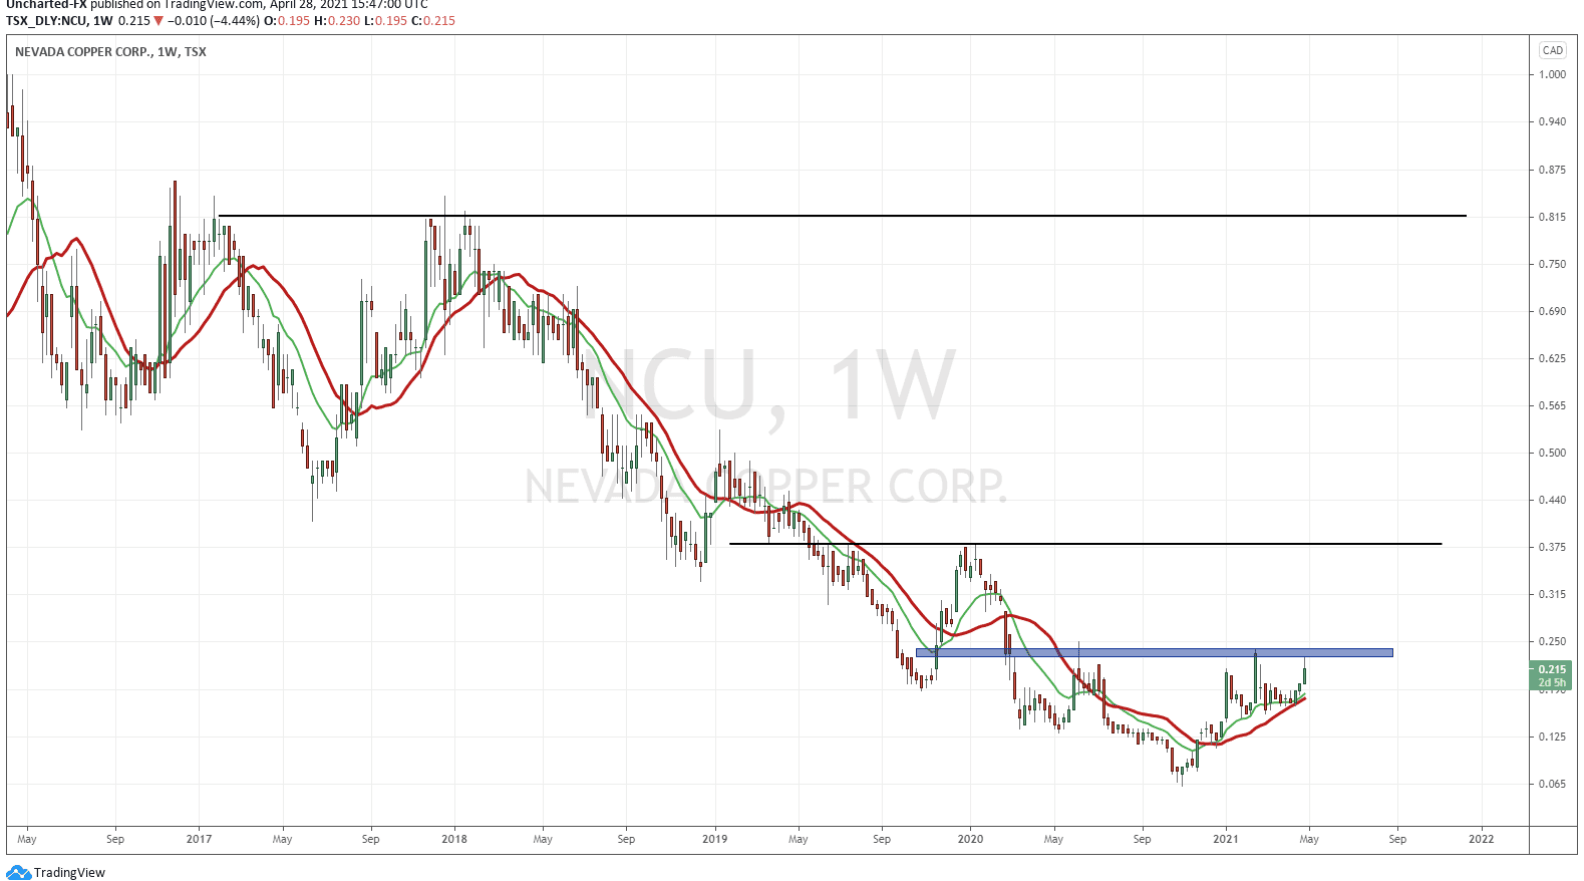
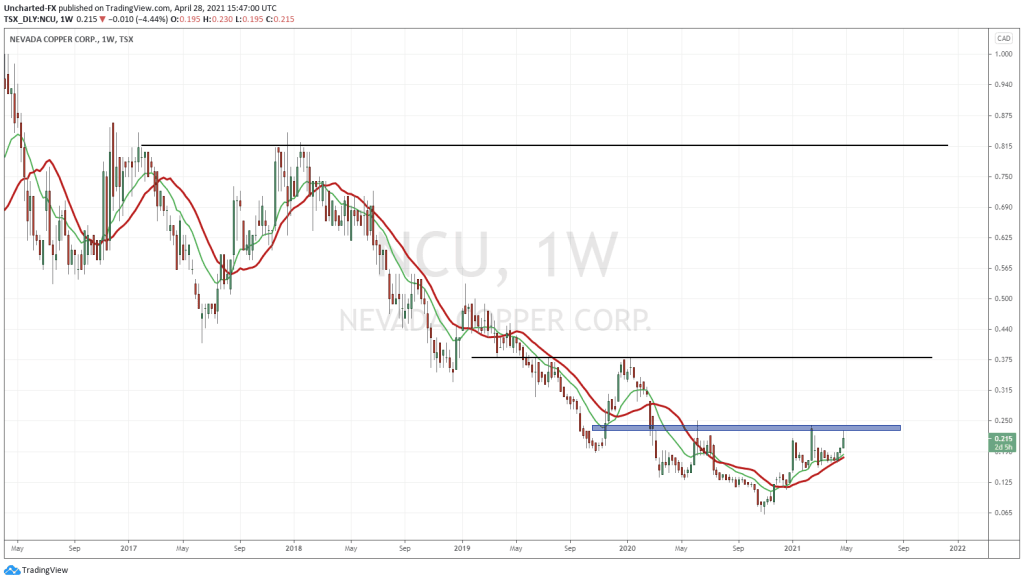
So with copper technicals looking good on the chart, I looked for a Canadian junior chart that is also showing a bottoming pattern which could rise while the copper chart is moving higher. The chart for Nevada Copper (NCU) is showing a quintessential bottoming pattern called the double bottom. It looks exactly as it sounds. In price action terms, we tried to make new lows (by breaking below previous recent lows) but price failed to do so, and we reversed creating a double bottom pattern. We know where the buyers have stepped in. Now the double bottom pattern is not confirmed nor triggered until we break and close above the neckline/resistance. On the chart for Nevada Copper, that would be a break and close above the 0.195 zone marked on the chart. This zone is also a flip zone (a zone that has been BOTH support and resistance in the past) so a break above here would be even more significant.
In terms of the company: “Nevada Copper (TSX:NCU) is a US copper producer and owner of Pumpkin Hollow, which hosts an underground project that is now in production, and an open pit development. The property is located in Nevada (USA) – rated by The Fraser Institute as the World’s #1 mining jurisdiction. The processing facility commenced production in December, 2019, using development ore stockpiled during construction of the underground mine”
Nevada Copper has been a stock I have followed in my days working for my Boutique Investment Bank. I liked the fact they were the most de-risked copper project (shovel-ready) for some time, and am glad to see they have started producing in December of 2019.
Just recently, Nevada Copper announced a 6 week suspension in production due to Covid-19 and restrictions imposed by government-mandated measures. However, one must consider that this all has already been factored in with the current downtrend on the chart. Nevertheless, this will affect their earnings coming out on May 11th/2020.
In terms of cash position, looking at their recent cash position, Nevada Copper is sitting on just over $1 million in cash. As with most new producers (or even established producers!) there is long term debt as well.


