

A translation of this article is available in Chinese at our content partner NAI500 here.
Gold is ending the year with a better than 17% gain, a move that has more than a few traders, fundamental and technical alike, glued to their screens, waiting for the (inevitable) assault on the $1560.00 – $15070 level.
The following (weekly) chart shows gold grinding out a solid 6-year high.
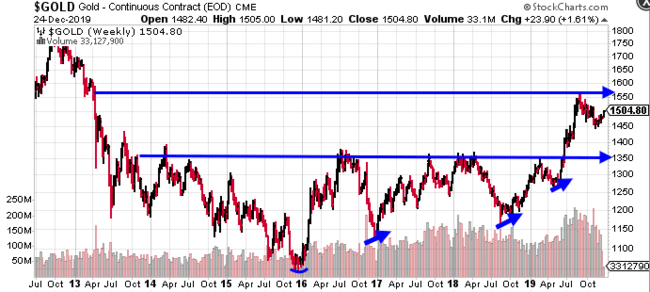
Note how gold blew through the $1350 level, a zone that held the metal in check since 2013.
Still on the weekly chart (above), note the$1052.00 low registered in late 2015 and how each subsequent rally was followed by a higher low (short blue arrows). This kind of stair-stepping price action is hugely bullish in my estimation. The ‘coiled spring’ analogy comes to mind.
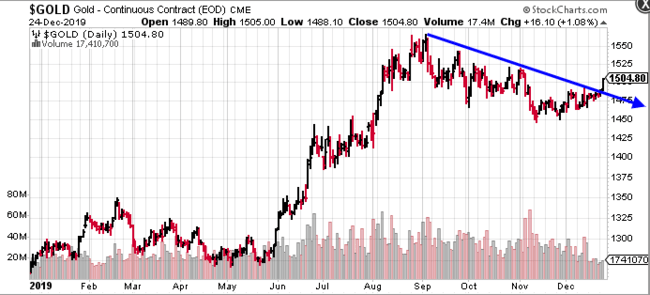
On a much shorter time-frame (chart below), gold is rounding out its impressive 2019 run with a solid late Q4 push higher, testing the $1500.00 level.
From a simple price pattern point of view, this trading action should, at the very least, pique your curiosity.
From a fundamental point of view, the backdrop for the metal couldn’t be more favorable: plummeting bond yields, negative interest rates, debt levels taking on a life of their own, pervasive geopolitical risk, and equity valuations stretched waaaay beyond reason.
It’s difficult to imagine a scenario where gold won’t go on a serious tear as we stagger into the next decade.
Debt – this is worrisome
We’ve discussed debt levels and currency debasement—numbers that challenge the imagination—ad nauseam in these pages.
To pound home the enormity of this imbroglio, we use visual aids.
Here’s another:
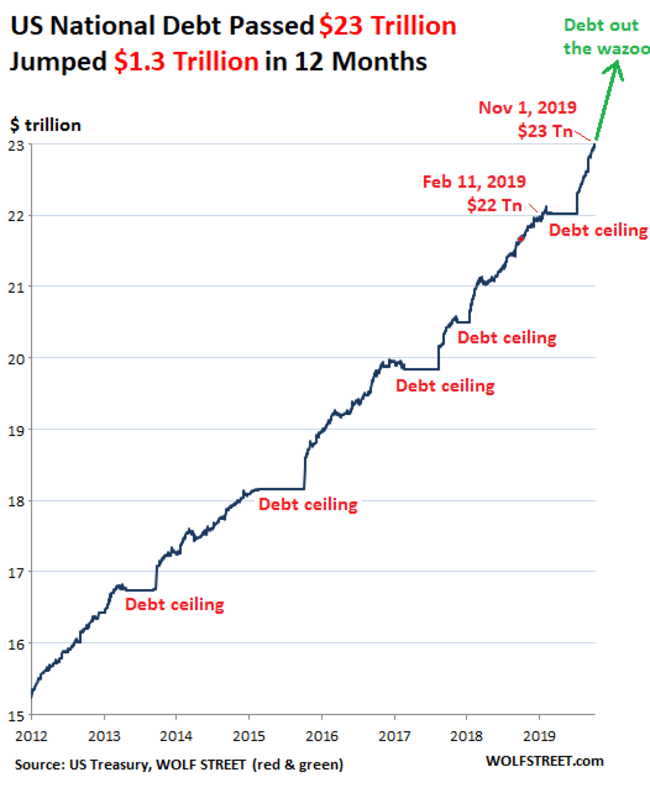
I swallow hard when I study these charts.
For a deeper delve into the underlying fundamentals currently supporting gold, the following Guru offerings will bring you up to speed:
The previous cycle
The following chart depicts gold’s price action from 2001 to 2011 when the metal emerged from a sub-$250.00 low, surging to a high north of $1900.00 (gold’s speculative $500.00 per oz flurry in the first 9-months of 2011 marked the cycle high).
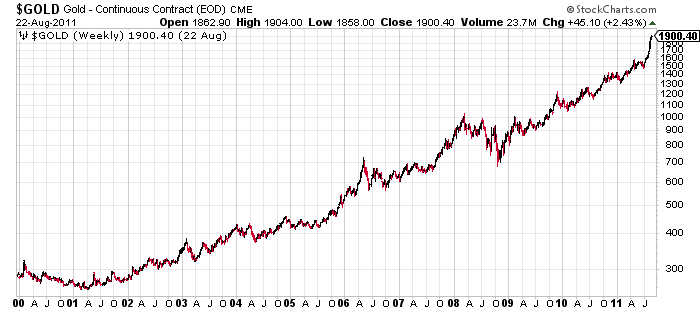
This chart could be a script for the type of price action we’ll experience in the years to come, especially if a Black Swan enters the fray.

Where I see the best leverage
Gold companies—those higher up on the food chain—have tacked on solid gains since gold shook off its chains late last spring.
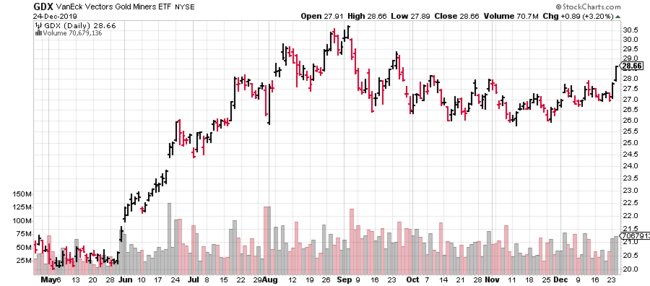
Those on the lower end of the food chain—the junior exploration companies or ‘ExplorerCos’—haven’t faired nearly as well.
For the vast majority of ExplorerCos, tax-loss selling has exacted a certain toll.
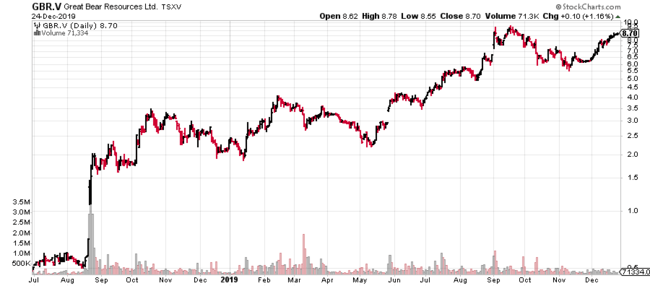
Of course, there are a handful of notable exceptions. Great Bear Resources (GBR.V) immediately comes to mind.
Tax-loss selling pressure, an event that occurs in the final two months of the year, is an interesting phenomenon, one that can be worked into a sound trading strategy.
If you were to sideline your funds for the better part of the year, deploying said funds into the hardest-hit tax-loss casualties at year-end, the first quarter of the new year could usher in respectable across-the-board gains, allowing you to take the rest of the year off.
Rinse and repeat—banks those gains, kick back, enjoy life, and resurface 10 months later.
Of course, as emotional beings, very few of us can trade with this kind of strict mechanical discipline. We all wanna be heroes.
I’ve always said that the worst possible karma for a rookie is booking two or more consecutive winning trades right from the get. Early trading successes tend to go to one’s head. An I-can-do-no-wrong belief takes hold, money management strategies fly out the window, and before long, the market does what it does best—it tears you a new one.
Back to year-end tax-loss selling, an excellent accumulation candidate is an asset-rich company pummeled for no good reason other than a tax-loss liquidation event. Stink bids can be deployed to take advantage of weak hands that get caught up in the downward spiral.
This year there are a plethora of tax-loss casualties in the resource sector.
We follow a great many ExplorerCos here at Guru Central. Some have been beaten down to ridiculous levels. The SEARCH function on this site is excellent. Entering the word ‘GOLD’ into the search serves up THIS.
I’m looking for a buoyant gold price in 2020. I’m also looking for the majority of the ExplorerCos we follow to catch a serious bid.
END
—Greg Nolan
Full disclosure: Great Bear Resources is not an Equity Guru marketing client.