Trade ideas and market discussion can be found on our Public Discord Channel: https://discord.gg/akcgCVP
It has already been a crazy overnight session. Oil, which is all the talk of the town, had a magnificent turnaround from the red into the green being up over 20%. The ten year yield is also now stabilizing and basing at a support level. These are the two things we look for to see higher markets.
However, this is just as of now. Oil can easily reverse in a day or two, and the ten year yield can fall. To be honest, I am watching the ten year yield rather than the price of oil in regards to impact on the stocks markets. Oil played a role because these large banks have large exposure to energy. They lent to oil companies back in 2014 to prevent massive layoffs. Now, these oil companies will need more debt just to pay the interest from their old debts, and to keep the lights on. Because the Fed has been giving money to the banks (through repo), and I am hearing that the big banks will be getting more money. Many have said the oil fall would hurt these banks because of their exposure… but money has and will be thrown at them. There is now talks of an energy industry bailout. It will happen.
The ten year yield is still reliable. Yes, the Fed is a big player in the bond market, however money will still be parked into bonds for safety. It makes no sense with low yield, but if you are parking money for a month or three before re-entering the market, this is still the modern portfolio theory of allocating to stocks and bonds given the market environment. Once again, this will not be making sense… some like Ray Dalio are saying we are already there.
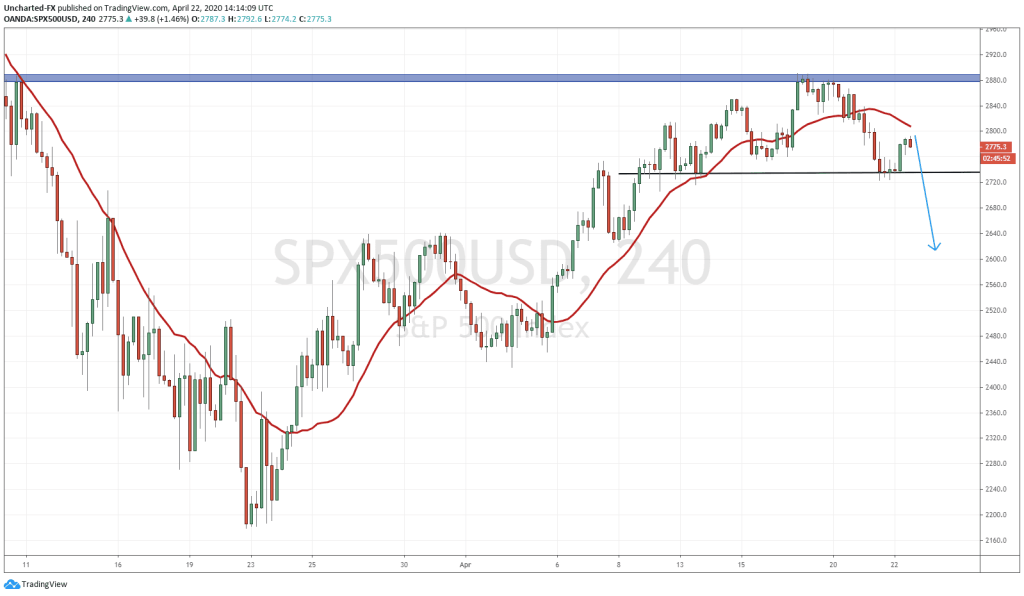
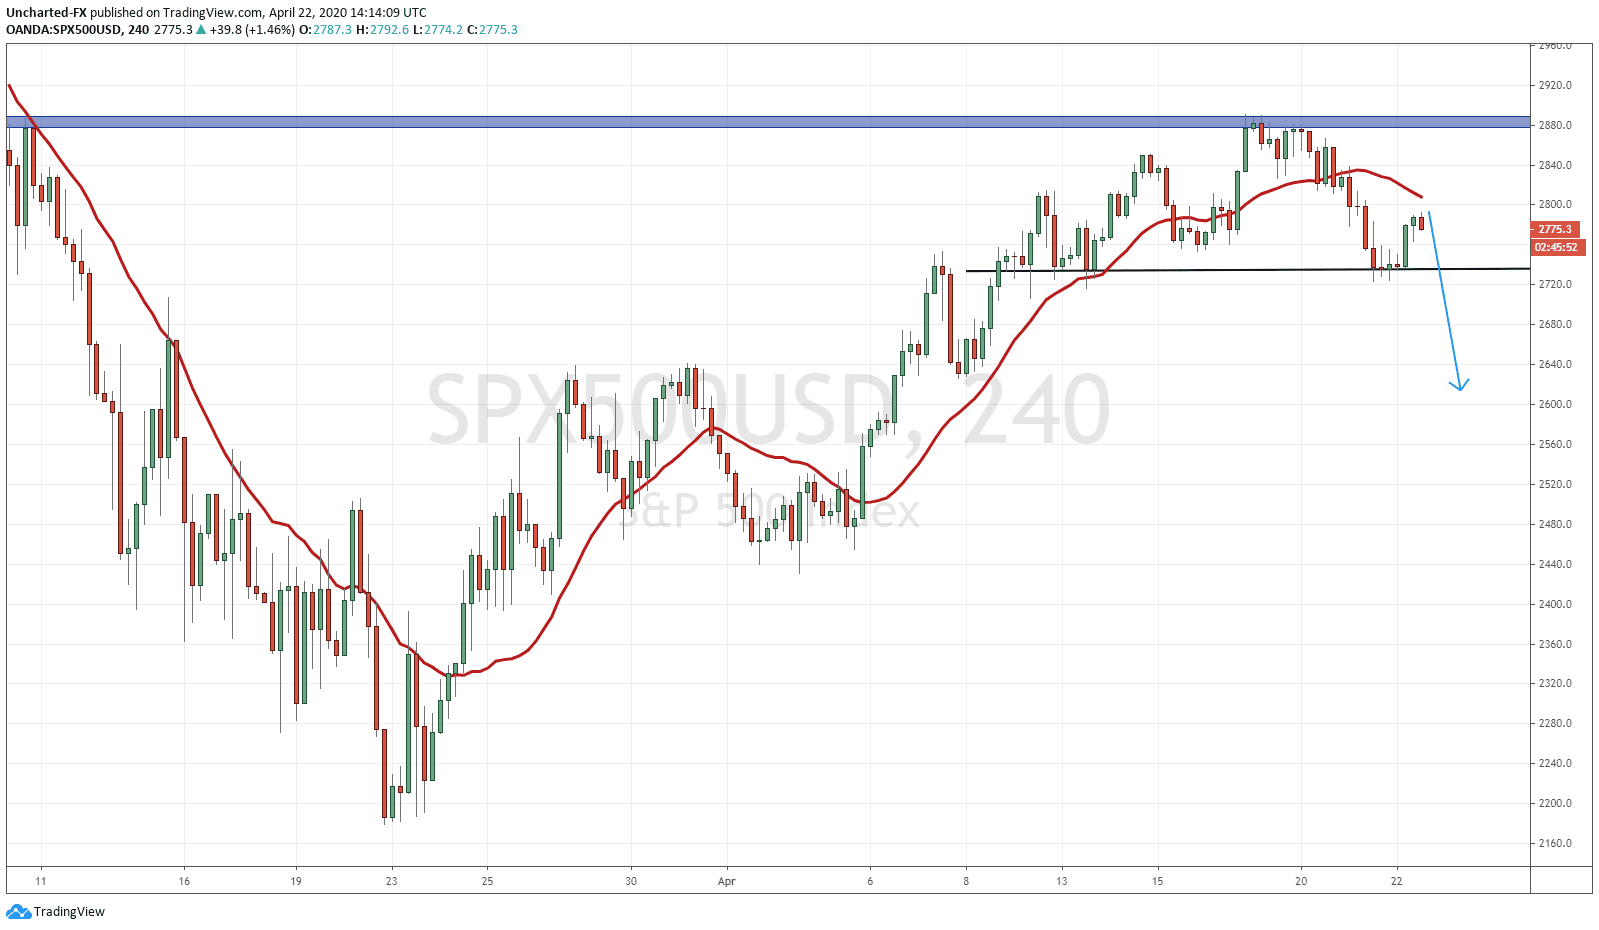
In terms of the equity charts, we have been watching this major resistance zone above. In past Market Moment posts, I have mentioned this large resistance zone on the daily chart. We were looking for either a break out higher, or some sort of pattern to indicate a new down trend wave. So far we have been ranging here. The pattern does look good for a short. We are forming what appears to be the quintessential reversal pattern: the head and shoulders pattern. What this pattern shows us is a reversal from one trend to another. In this case from an uptrend to a down trend.
What we are watching for over at the DIscord channel, is for a break and close below this support level marked. This break and close would confirm this head and shoulders pattern and confirm the reversal. Very similar approach to trading the Nasdaq and the Dow.


