
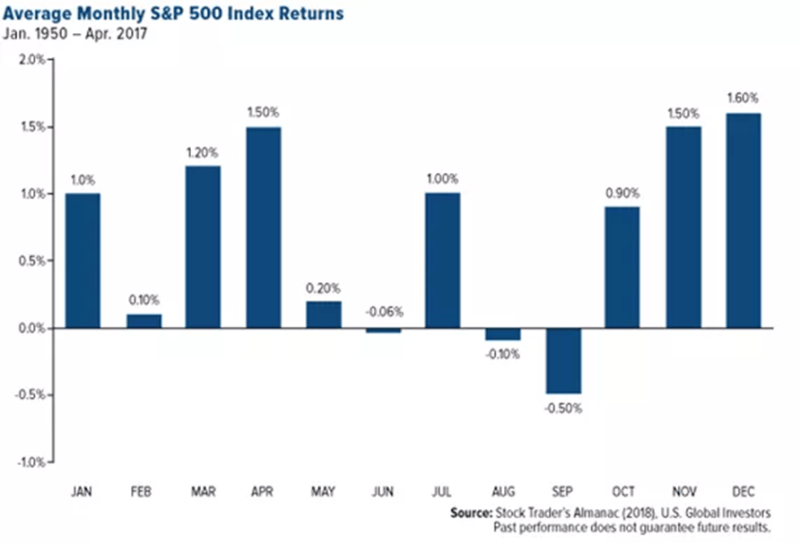
It is nearing Christmas which means that liquidity is slowly draining away. This sometimes means a quiet market on most days, but major volatility with big macro events such as the upcoming Fed meeting. What traders and investors really love about December is the Santa Clause rally. December historically is the best month for market returns.
With US stock markets and global markets bottoming in October and beginning a new uptrend, the outlook looks positive for following the average returns we see in the last three months of the year.
But are things different? We do have the whole idea of a “Fed Pivot” to end the year where market participants are expecting the Fed to be a bit more dovish and even signal the pausing of interest rate hikes. This has caused a market rally but what if the markets are wrong? Fed members have been saying different things. We have even heard one Fed President say interest rates will need to go higher between 6-8% which is higher than expectations.
The key is not the slowing of the pace of rate hikes (50 basis points hikes instead of 75) but the terminal rate. Where will interest rates be when the Fed pauses or decides to stop tightening because inflation is coming down. Historically, inflation above 5% has never been tamed with interest rates being lower than the rate of inflation. Inflation numbers will be key and the argument is whether it is due to supply chain issues, consumer spending (more money competing for the same number of goods), or the true definition of monetary inflation, too much money printing.
When you add geopolitics such as Russia-Ukraine, the current situation in China, cryptos and FTX, the yield curve inversion, pending recession… the world really looks unstable and fear may drive risk off.
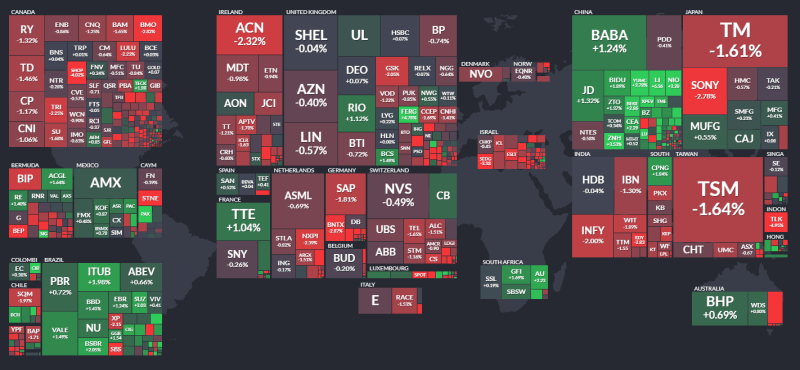
Global stock markets have had multiple higher lows and higher highs in this recent uptrend, but daily charts are showing signs of a reversal. Here I will display the technicals I am currently seeing, but remember: the major fundamental event upcoming is the Fed meeting on December 14th. This could trigger a major year end rally, or confirm the reversal technicals.
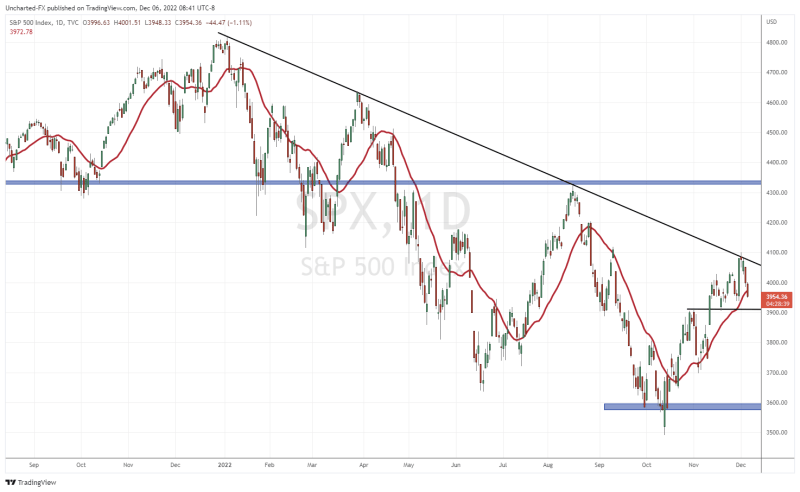
Starting with the S&P 500, we have hit a wall after a nice uptrend. Many equity charts will look like this.
After a major rally day on November 30th 2022 due to Powell hinting at the Fed talking about slowing down rate hikes, the momentum has been killed. A very bearish sign after a major rally day. We actually rejected a long term downtrend line that many technical traders are watching. This trendline connects the lower highs going back to the previous record highs.
Going forward, the key support level will be 3900. If we close below this, then this current uptrend is over.
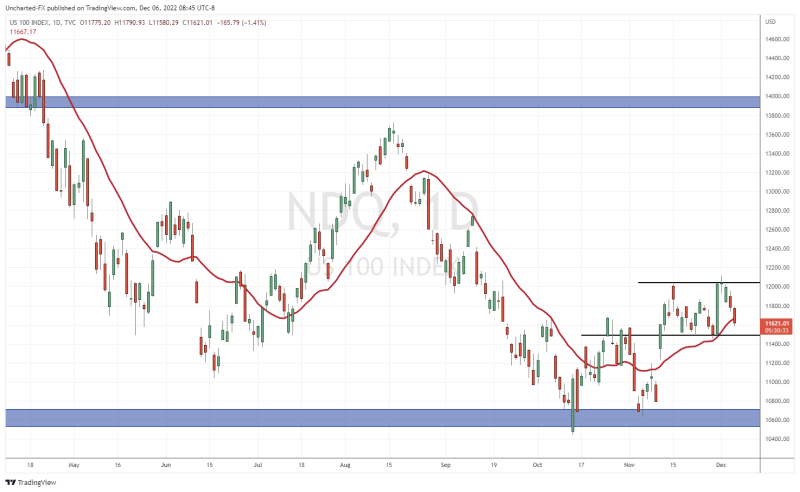
The Nasdaq had the best reversal set up with the double bottom pattern trigger. Unfortunately, no momentum to carry forward the breakout. The Nasdaq is now ranging between 12,000 and 11,490. Traders just need to wait for the breakout to give direction. Currently, the bias is towards a higher Nasdaq, but the Fed could cause the breakdown.
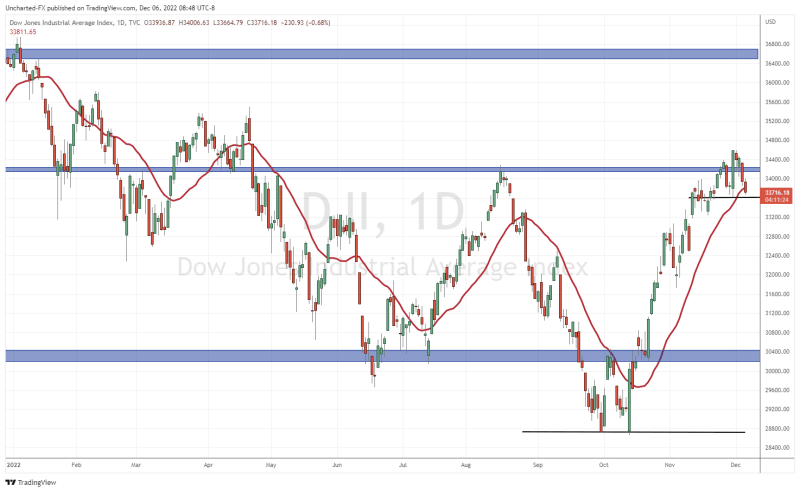
The Dow Jones is the US market which has seen the largest rally. I believe this is indicative of foreign money heading into the US for safety. Think about investors in Asia and Europe. The US market looks like the best place to park money, and most of that will be going into the largest dividend companies.
The Dow is looking slightly toppy here after making a couple of waves to the upside. A reversal pattern could trigger with a close below 33,600.
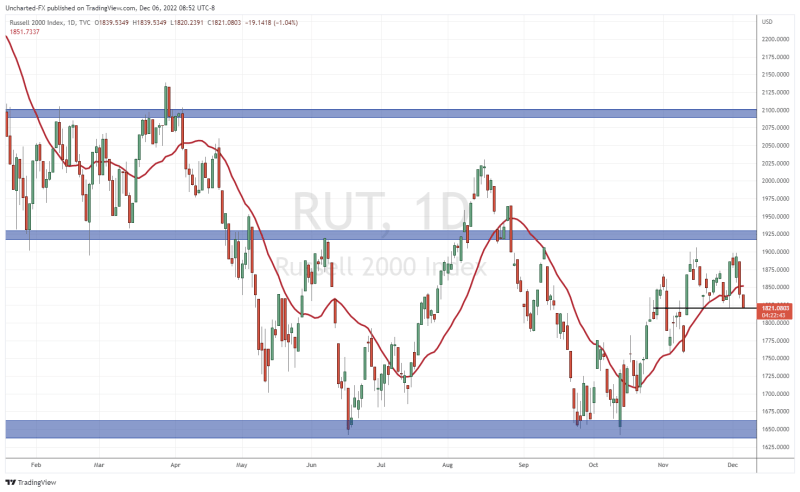
The Russell 2000 stock market has me a bit worried. This market tends to lead the major three markets. The Russell looks ready to break below its major support here. We are actually testing it at time of writing. A close below would be bearish for all US markets.
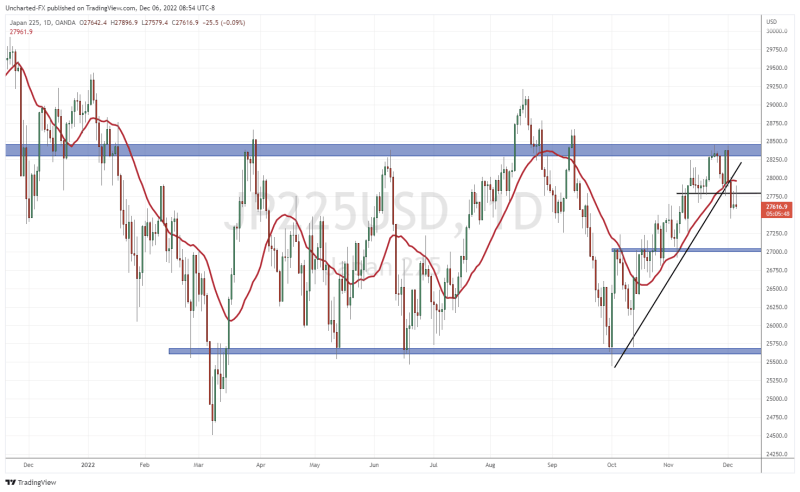
The Japanese Nikkei has already triggered a bearish reversal. An uptrend line has broken, and we closed below support. Every rally is also being sold off at the breakdown zone.
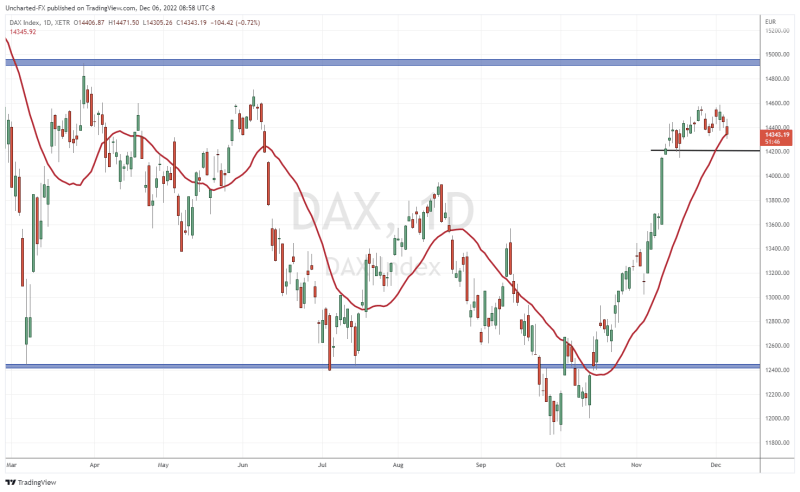
The German Dax is also looking toppy. After hitting 14,600 the Dax seems like it will be confirming a double top pattern. The pattern still needs to trigger! A close below 14,200 confirms the breakdown.
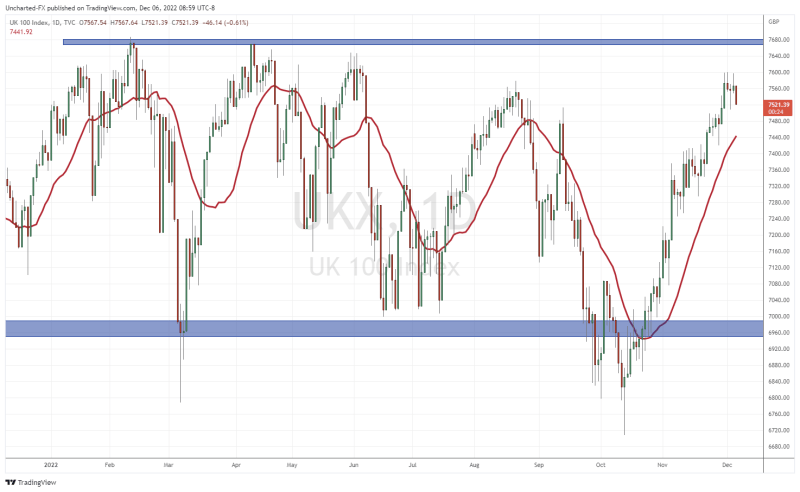
The UK FTSE is also showing signs of a range exhaustion here near a major resistance zone. Still waiting for a prominent range to develop.
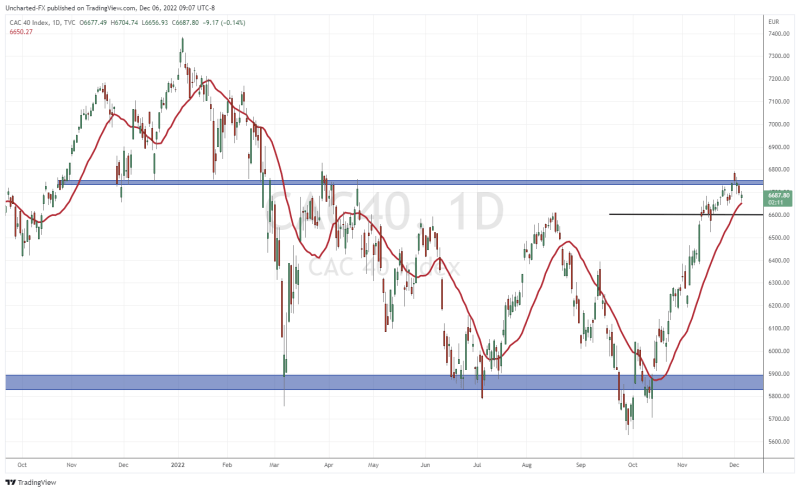
The French CAC market just hit a major resistance zone and attempted to close above it. No success. Now we wait for a breakdown.
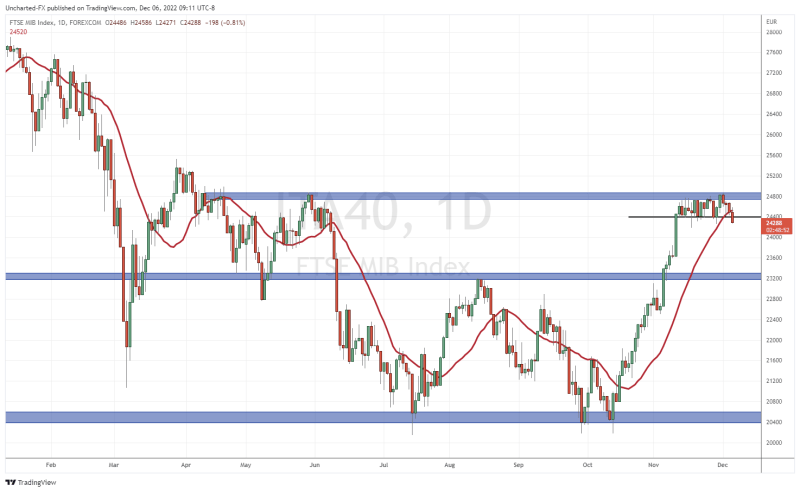
The Italian market is the European market triggering a notification on my trading platform. Look at that daily range. Look at that pending breakdown. A reversal looks likely here. All that is required is a confirmation close.
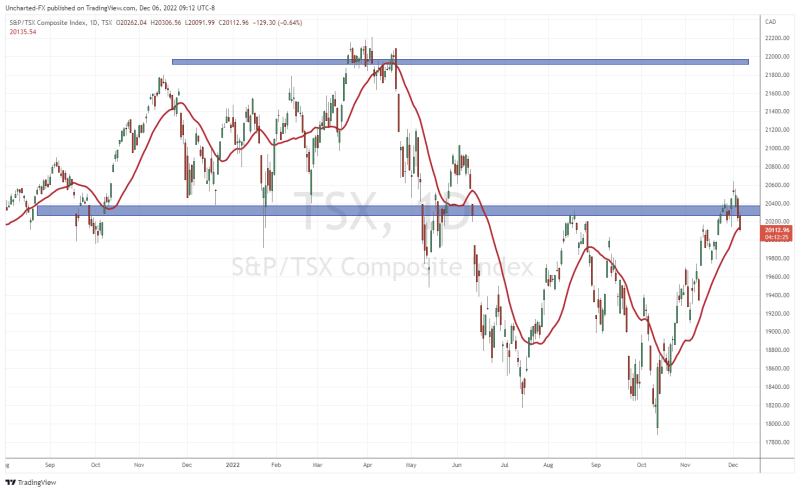
We will end off with the Canadian TSX. Very similar to European and US markets. We have had a nice rally higher, and now have tested a major resistance zone. Sellers are piling in. On December 7th, we hear from the Bank of Canada who are expected to announce a rate hike. How much, and the language afterwards will be important.
The reaction to a dovish (or hawkish!) central bank will be a sneak peek to how US markets may react post Fed the following week.