
US Stock Markets had a wild week of ups and downs last week. What made it different from other periods of volatility was that we were making these swings at major support. Zones that if broken, would signal the end of the current uptrend. Friday closes were positive, but we aren’t out of the woods just yet. US Stock Market futures are live, and at time of writing, they are stable. Big moves over in Europe on some indices so let’s hope the US markets follow tomorrow.
If you are a stock market trader, or even a crypto trader because Bitcoin does follow stocks right now as a risk on asset, there are THREE significant charts you must watch this week and going forward. They will play a pivotal role in whether markets hold support, or breakdown.
Before we delve into those charts, let’s take a quick look at some US market indices:

The Nasdaq is at the very top of my radar just because of where it is. Our major support AND lower channel trendline are being tested. We held both times with we breaking below both these levels. Buyers came in to buy and force the daily candle to close above the two technical supportive zones, nullifying a breakdown. For bulls, we hope this continues. We want to see epic wicks indicating buyers stepping in.
By the way, some of the big tech companies like Apple and Tesla to name a few are holding up well while the index comes under pressure.
Very simple game plan for the week: we want to see a very nice bounce from here. We do want to remain above support. A close below ends this uptrend.

The small cap index, the Russell 2000, is next on my list. We are testing a support zone held since March 2021. Two times last week, we saw buyers jump in at this support. The hope is we hold above. A breakdown would mean a small cap downtrend or bear market. The Russell is the one that looks attractive for a trade. Buying close to support and nestling stop losses below.

Not much to say on the S&P 500 other than hold the channel. That’s it really. I would also love to see a close back above 4730, or last week’s highs to keep this going into new record high territory.
Now that we have established that a couple of the US indices are at major support, we need to assess whether we buy at these attractive zones, or if we should prepare for further downside. It gets complicated on the fundamentals, but this is where we can follow the money to determine where markets will be going.

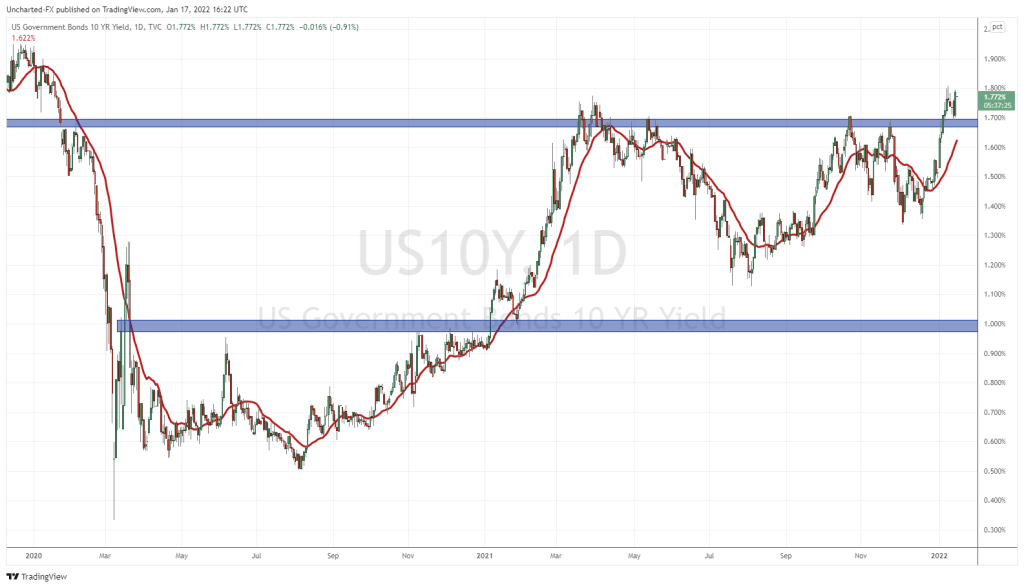
The 10 year yield is perhaps the most important chart to watch. Yields are rising. Investors seem to be pricing in Fed rate hikes this year.
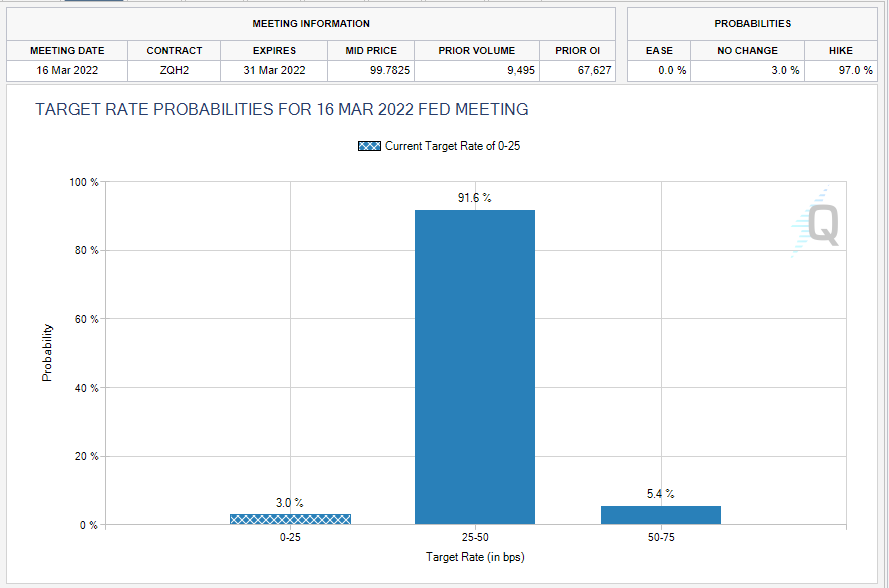
With Fed Funds showing a 97% rate hike in March 2022, that rate hike is pretty much already priced in the markets. The bigger question is how many more hikes by the end of 2022? This is where the 10 year yield can come in handy.
The chart is looking extremely bullish. We broke above 1.70%, pulled back to retest, and saw immense buying on said retest. Looking like yields will continue higher. If we start pushing the 2% level, stock markets may come under pressure.
If these markets are propped up because of cheap money, then rate hikes would definitely deflate markets. In fact, Cathie Wood is now talking about deflation investing.
The confusion comes from the Fed and the media. Fed chair Jerome Powell had a slightly less hawkish testimonial last week Monday. However, Fed Brainard and Harker reinstated their hawkishness and said the Fed has tools, and will be looking to raise rates 3 to 4 times this year. Markets really didn’t like that, selling off on Thursday.
Now here is where the media comes in. On Friday, they were talking about the dismal US retail sales numbers. Retail sales, and employment for December 2021, a time when both data sets are strong due to the holiday period, missed by a long shot. The question being posed now is if the Fed can even hike in a weak economy.
My take is that the Fed will hike in March. They must with markets pricing in a close to 100% probability. But it might be a ‘one and done’, or something could change from now until March on the pandemic side of things. Perhaps the Fed slows down a bit and starts talking about whether current monetary policy is still needed to support a weak economy.
Add inflation to the mix, and we definitely have some drama. If inflation is rising uncontrollably, the Fed will need to raise rates very quickly. But the Fed has said inflation will fall back to below 2% sometime this year. The whole ‘transitory’ inflation narrative. That inflation is here due to supply chains and not because we have an environment where there is more money competing for the same number of goods and services because productivity has not increased. The market buys it right now, but if inflation numbers keep breaking records closer to the mid of 2022, will the market start losing confidence in the Fed?

Oil has gone under the radar of most people. I mean it is understandable. Many people have been focused on stock markets. Oil is now looking to break above last year’s highs. If so, we see above $90 a barrel, and might even see $100 in the next three months. The chart is looking bullish, but we have run into resistance.
Usually when oil rises, we see banks and energy do well, which help prop up stock markets. We haven’t really seen that throughout this stock market romp. That is because markets are more concerned about interest rate hikes. But an oil breakout here could be supportive for stocks. It would suck for the middle class though.
Is oil rising because of inflation? I consider it a good commodity/hard asset trade. As my readers know, I have been bullish on oil and other commodities for some time. Commodities are a great place to be. Or is there another reason?
I am thinking geopolitics. We all remember that price war President Biden started. The US and other nations wanted OPEC plus to take action to lower prices. They said no, because let’s face it, Russia and Iran probably don’t want to do the US any favors. President Biden responded by saying the US and other nations will dump reserves. This all happened when Oil prices were less than $75. Clearly it did not work.
An interesting observation is that oil is popping, and some of the oil linked currencies like the Russian Ruble, Canadian Loonie, and the Norwegian Krone were not gaining. And these currencies are heavily positively correlated with oil. I am not saying this is correct, but I am thinking something geopolitical is brewing. Likely with Russia. A black swan event could see stock markets drop while oil rises. Or maybe I am thinking too much of it, and this is really a trade pricing in higher inflation.

We end off with a crucial chart for stock markets, gold, commodities, crypto and the forex markets in general. The US Dollar chart confirmed a new uptrend after breaking out above 93. It seems the markets back then were pricing in a hawkish Fed. The Dollar ranged for 7 weeks, until finally breaking down last week. Perhaps the markets are pricing in less hikes than expected.
The Dollar is set to retest a major weekly support this week. The 94.50 zone must hold by Friday for the Dollar bull run to continue. We might be seeing a big dollar green move this week. This could put pressure on gold and silver and other commodities. A stronger dollar is often seen as stock market negative, so keep this in mind.
If stock markets are fearful of multiple rate hikes, we can use the charts of the 10 year yield and the US Dollar to determine whether more hikes are coming or not. It is setting up to be a big week for stock markets as they still hold our major support. Watching these 3 charts will determine whether we continue higher, or if these major supports break.