A week with a lot of macro news impacting agriculture and stock markets in general. Been a busy week, but hey, all the macro reasons for us being bullish agriculture and ag tech are coming true. This is why I am bullish this space, and why investing in some agriculture and ag tech stocks will pay handsome returns in the future. A reminder: this piece details my overall macro thesis on why I am going big on Agriculture. Look at the four macro points, and compare them to what is happening now. And honestly, it is just beginning. We are still early so don’t fear, we are not chasing moves just yet. We are getting in and building positions before the FOMO kicks in for investors not watching this space.
This sector piece will discuss the three top macro news out this week, and I shall explore the top three agricultural commodities: Corn, Wheat and Soybeans. It is prudent to know the macro and big picture take on these commodities. It’s like researching Gold and its dynamics and fundamentals before investing in Gold miners and juniors. An analysis on these agricultural commodities will provide us with a great foundation to build on going forward.
Besides the FOMC minutes, September CPI data was highly anticipated. After months of rising used car prices impacting inflation the most, prices cooled off. But unfortunately for the middle class, rising energy costs and FOOD costs will be pinching pockets. Here are some CPI data headlines:
The consumer price index for all items rose 0.4% for the month, compared with the 0.3% Dow Jones estimate. On a year-over-year basis, prices increased 5.4% versus the estimate for 5.3% and the highest since January 1991.
Food prices also showed notable gains for the month, with food at home rising 1.2%. Meat prices rose 3.3% just in September and increased 12.6% year over year.
“Food and energy are more variable, but that’s where the problem is,” said Bob Doll, chief investment officer at Crossmark Global Investments. “Hopefully, we start solving our supply shortage problem. But when the dust settles, inflation is not going back to zero to 2 [percent] where it was for the last decade.”
Last night when I was on google, the top trending search was “Supply Chain Issues”…also something about a Nicki Minaj song. Lot of supply chain issue headlines from mainstream and financial media. Something I was predicting months ago. It has gotten to a point where President Biden and his https://e4njohordzs.exactdn.com/wp-content/uploads/2021/10/tnw8sVO3j-2.pngistration are addressing bottlenecks in the global transportation supply including the port of Los Angeles being open 24/7 to deal with the cargo ships just waiting in line.
Rising prices means someone is winning. And in the US, it seems some Farmers are bringing in the big bucks after a rise in crop prices and a rise in exports to China. We are talking about income booming to near decade highs.
USDA estimates farm income from crops to surge around 20% to $230.1 billion in 2021, the second-highest ever, almost surpassing the record in 2012. Pictured below is the income from crop sales vs the income from government payments going back to 1992. Heck, we may take out those 2012 highs. If this was a tradeable chart, I would be bullish.
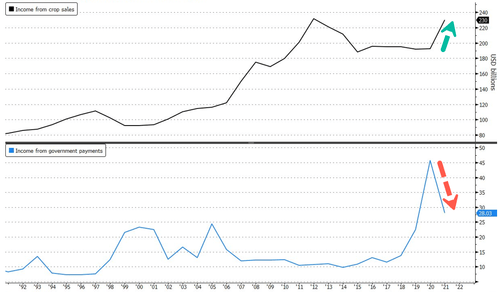
Where do we go from here is the big question. How long will the ‘good times’ last? Supply chain issues means that the costs of everything will rise. For farmers, this also includes energy, fertilizers, machinery and even labor costs. All of which will squeeze profit margins.
The next major news piece I will cover points to the party perhaps finishing sooner than anticipated. Rising costs and certainty might doom farmer income, but they will have to continue to operate since food is very important to us.
The USDA’s monthly World Agricultural Supply and Demand Estimates, simply referred to as the WADSE report, was bearish Corn and Soybeans but bullish, or constructive at least, for Wheat. The agency has increased its estimates for US Corn and Soybeans ending stock for 2021/22. While estimates of US Wheat ending stock has been revised lower. Here is a more detailed rundown on the data:
The agency increased its estimates for US corn ending stocks for 2021/22 from 1.41b bushels to 1.5b bushels on account of higher beginning stocks, a marginal increase in domestic production and lower domestic demand. US corn export estimates were revised marginally higher from 2.48b bushels to 2.5b bushels. Similarly, for soybean, estimates of US inventory at the end of 2021/22 were revised higher from 185m bushels to 320m bushels on account of an upside revision in beginning stocks and domestic production for the year. US soybean production estimates were revised up from 4.37b bushels to 4.45b bushels as favourable weather appears to have helped the crop. Soybean export estimates were left unchanged at 2.09b bushels. The report was constructive for wheat with estimates of US stocks at the end of 2021/22 revised down from 615m bushels to 580m bushels due to lower production and imports.
Globally, corn ending stocks estimates for 2021/22 were revised higher by around 4.1mt, mostly on account of upward revisions in beginning stocks (+3.5mt) from the US and China. Global demand and supply estimates saw only marginal changes. For soybean, the agency revised higher 2021/22 ending stock estimates by around 5.7mt to 104.6mt. The bulk of the increase comes from the upward revisions in beginning stocks (+4.1mt), while the remainder comes from revisions higher in output (+0.7mt) and lower demand estimates (-1.1mt). Changes to the global wheat balance were constructive. Global ending stocks for 2021/22 were lowered from 283.2mt to 277.2mt, largely due to lower beginning stocks. Global production estimates were revised down from 780.3mt to 775.9mt.
Before this report was released, Zerohedge reported on Bloomberg expecting an increase estimate in domestic corn and soybean stockpiles. In this same piece, they quote some farmers saying:
Even with record drought and back-to-back heat waves in the western half of the U.S., farmers like Zach Egesdal in Iowa still “produced better than we thought with the limited moisture.”
“We’ve sold more than we have in the last few years out of the field for both corn and soybeans,” Egesdal told Bloomberg. “We were able to lock in a profit and made more sales.”
“All of our inputs for next year are going to be significantly higher than what they were this past year,” farmer Pat Swanson from Iowa said.
Corn, Wheat and Soybeans are the primary traded agricultural commodities. I used the Gold example earlier, but when I want to gauge where agriculture stocks are likely heading, I turn to the charts of Corn, Wheat and Soybeans. So to end this weeks Agriculture macro roundup, let’s breakdown the charts and major exporters for the commodity.
Corn
Corn is the most traded agricultural commodity, and is an important food source for both humans and animals. What makes Corn important is that it can be grown in a variety of climates and conditions, unlike the other agricultural commodities. Other uses include starches, corn oil and fuel ethanol. According to my handy dandy commodity handbook, approximately 35 million hectares are used exclusively for corn production world wide.
Just as Oil has different qualities (Brent, West Texas, Canadian West etc), Corn does as well. There are different grades but the most important are high grade number 2 corn and number 3 yellow corn.
The futures ticker for corn contracts is ZC. The top 5 producers of Corn in the world are: The United States, China, Brazil, Mexico and India (Canada makes it in 9th place). For those interested in exploring more about corn, visit corn.org.
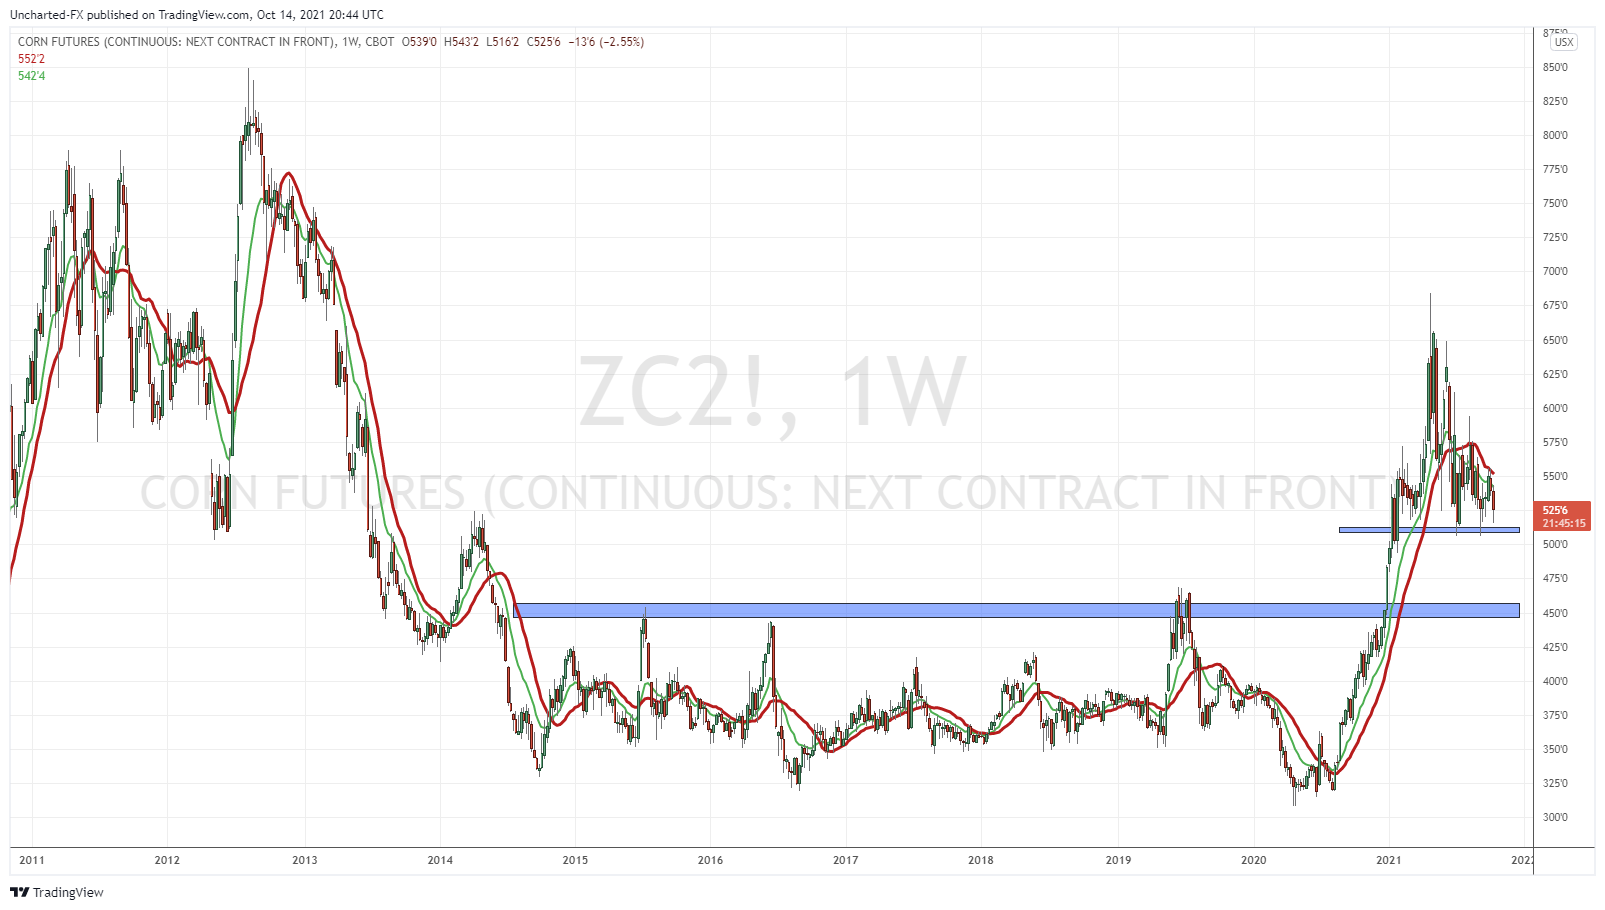
Corn has had a great year, but has given up most of the gains. Yet the commodity holds gains of 6.71% year to date. I’ll be honest, the breakout I called earlier this year is coming under pressure. A second higher low with another leg higher is still possible. But how Corn reacts in the next few weeks will be off importance for us agriculture investors. Can you see the technical pattern? Yup, it looks like a head and shoulders pattern. But remember: the trigger is the breakdown confirmation. In this case, a weekly close BELOW the support around 510. If Corn gets a close below, then we will give up the year to date gains, and retest the major breakout at 450. Technically, it’s okay because breakouts need to see an eventual retest. It just means the roaring Corn prices might be delayed by a few months time. So let’s keep an eye on this support. A push above 575 would help in strengthening the case for a second higher high in the upcoming months.
Wheat
Wheat is the second most produced agricultural commodity. Rice comes in at third for those that are interested. No country necessarily dominates wheat production a la Saudi Arabia with Oil and Kazakhstan with Uranium.
China, India, Russia, the United States, and France produce the most wheat in the millions of tons. Canada, Australia, Germany, Pakistan, and Ukraine also boast significant production.
The future contract ticker for Wheat is ZW. For those interested in wheat, visit wheatworld.org.
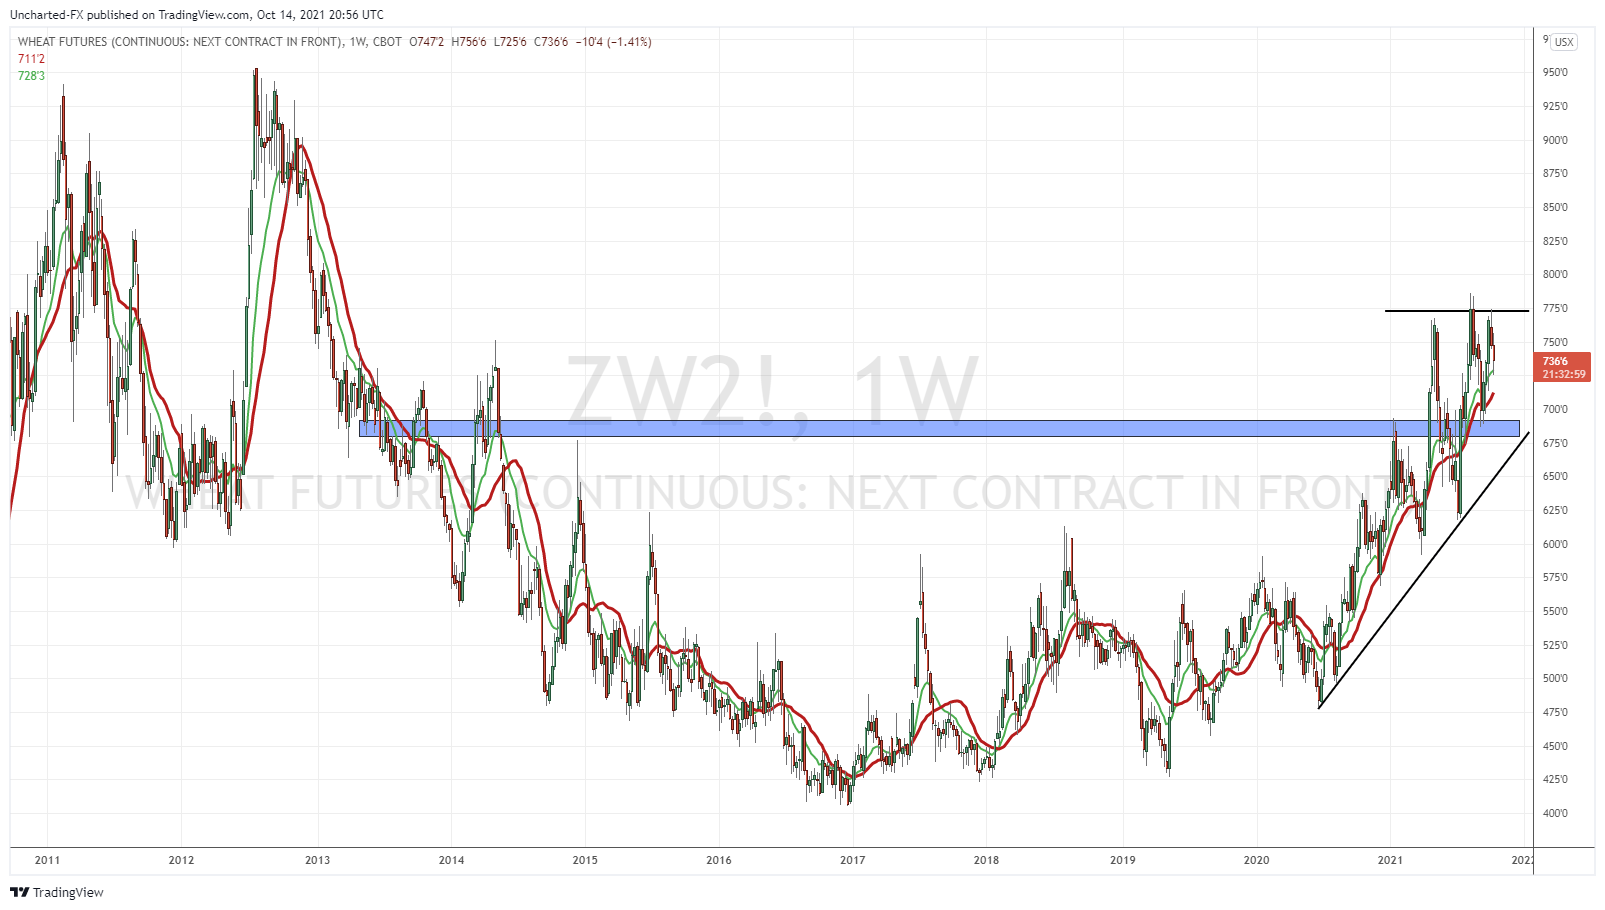
Wheat is holding gains of 13.08% year to date. The WADSE report was bullish wheat on lower estimates. The chart shows it. Note the uptrend line. Just by looking at the slope, one can tell the trend remains intact. I like this weekly break over 700. We should expect to see more higher lows and higher highs. To the upside, we still have plenty of room before testing resistance.
I said Corn can be grown in a variety of climates. Wheat is more finnicky. Perhaps this is why climate change and change in seasonal weather could be impacting Wheat production more, hence why the lower growth estimates on the WADSE report. Wheat is the one I follow more closely since it makes a larger part of our diet…or maybe just my diet. Sure trends are shifting with gluten free diets. I remember Ryan Reynolds said back in the day that one could rob a bank in Los Angeles with a bagel. But for most people, bread, or wheat based foods make an important part of their diets. Embrace the carbs. Don’t fear them.
Soybeans
Finally, Soybeans. Perhaps the more ‘mainstream’ financial media agricultural commodity that has seen plenty of coverage due to the US-China trade deal. If you remember back during the President Trump days, part of the phase 1 deal was for China to increase their purchases of US Soybeans.
I am focusing on the the whole soybean, but most soybeans are used for soybean oil and soybean meal. For those interested in Soybeans, visit soygrowers.org.
The United States dominates the Soybean market, composing 50% of the total global production. Brazil comes in second at around 20%. Many analysts predicted Brazil to be the big winner in a US-China trade war spat, as China could look to Brazil for more Soybean exports, and leaving the US holding that extra soy.
The futures contract for Soybeans is ZS. Let’s take a look at the other traded forms of soybeans which have their own futures ticker.
Soybean Oil is a vegetable oil and is one of the most used culinary oil in the world. Soybean Oil is also popular as a biodiesel. Believe it or not, but there are cars that have engines which can convert from regular diesel to Soybean Oil during production. They are known as ‘frybrids’. The futures ticker for Soybean Oil is ZL. Soybean Oil is one of the best performing agricultural commodities of 2021, holding onto 42.36% gains year to date. Chart wise, we have a nice bullish flag printing, hinting at higher prices.
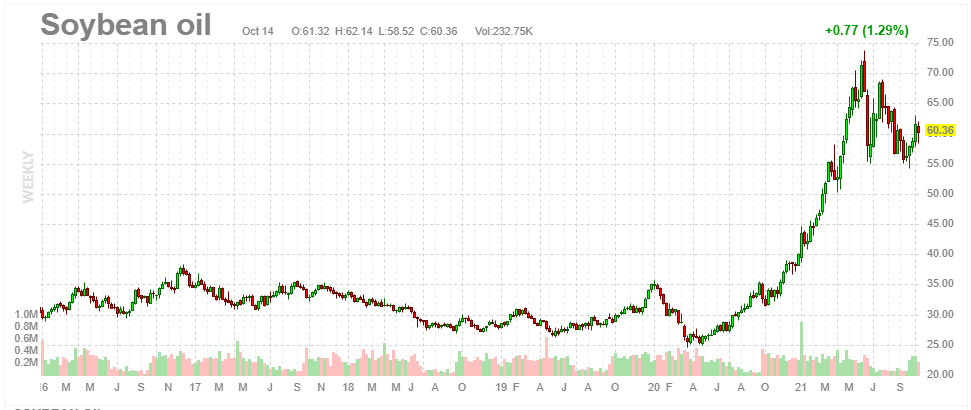
Soybean Meal is a quick one. Whatever is left from the extraction of Soybeans into Soybean Oil can be converted into Soybean Meal. This is used for high-protein, high-energy food for feedstock for cattle, hogs, and poultry. The futures contract for Soybean Meal is ZM. This is the worst performing agricultural commodity of the year. Soybean Meal started the year hot, but is now down -26.76% year to date. If agricultural as a whole gets a lift, then this would be the bottom picker.
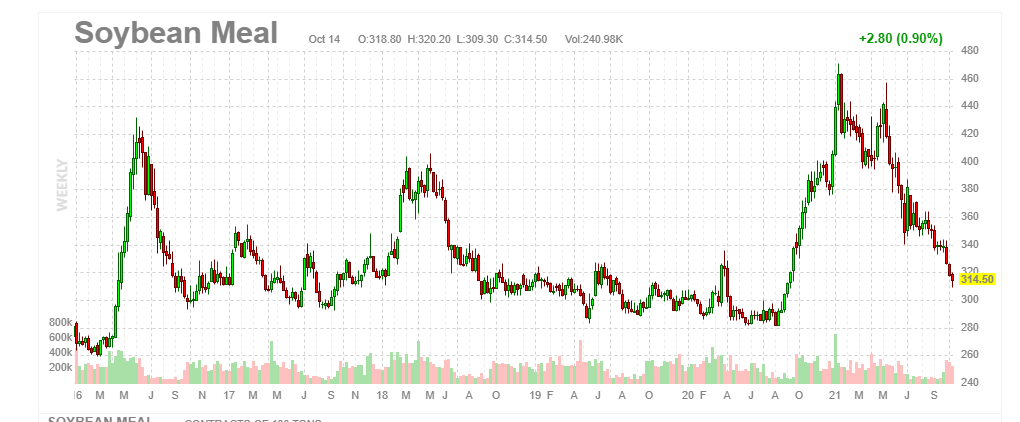
Soybean Oil and Soybean Meal are at completely opposite ends of the spectrum. Technically, one can play breakouts knowing when to enter positions. Breakdowns tell us when to get out. But this is why it pays to take some extra time to learn about the fundamentals behind agricultures. Demand for Oil for culinary is high, while demand for meal for livestock is low.
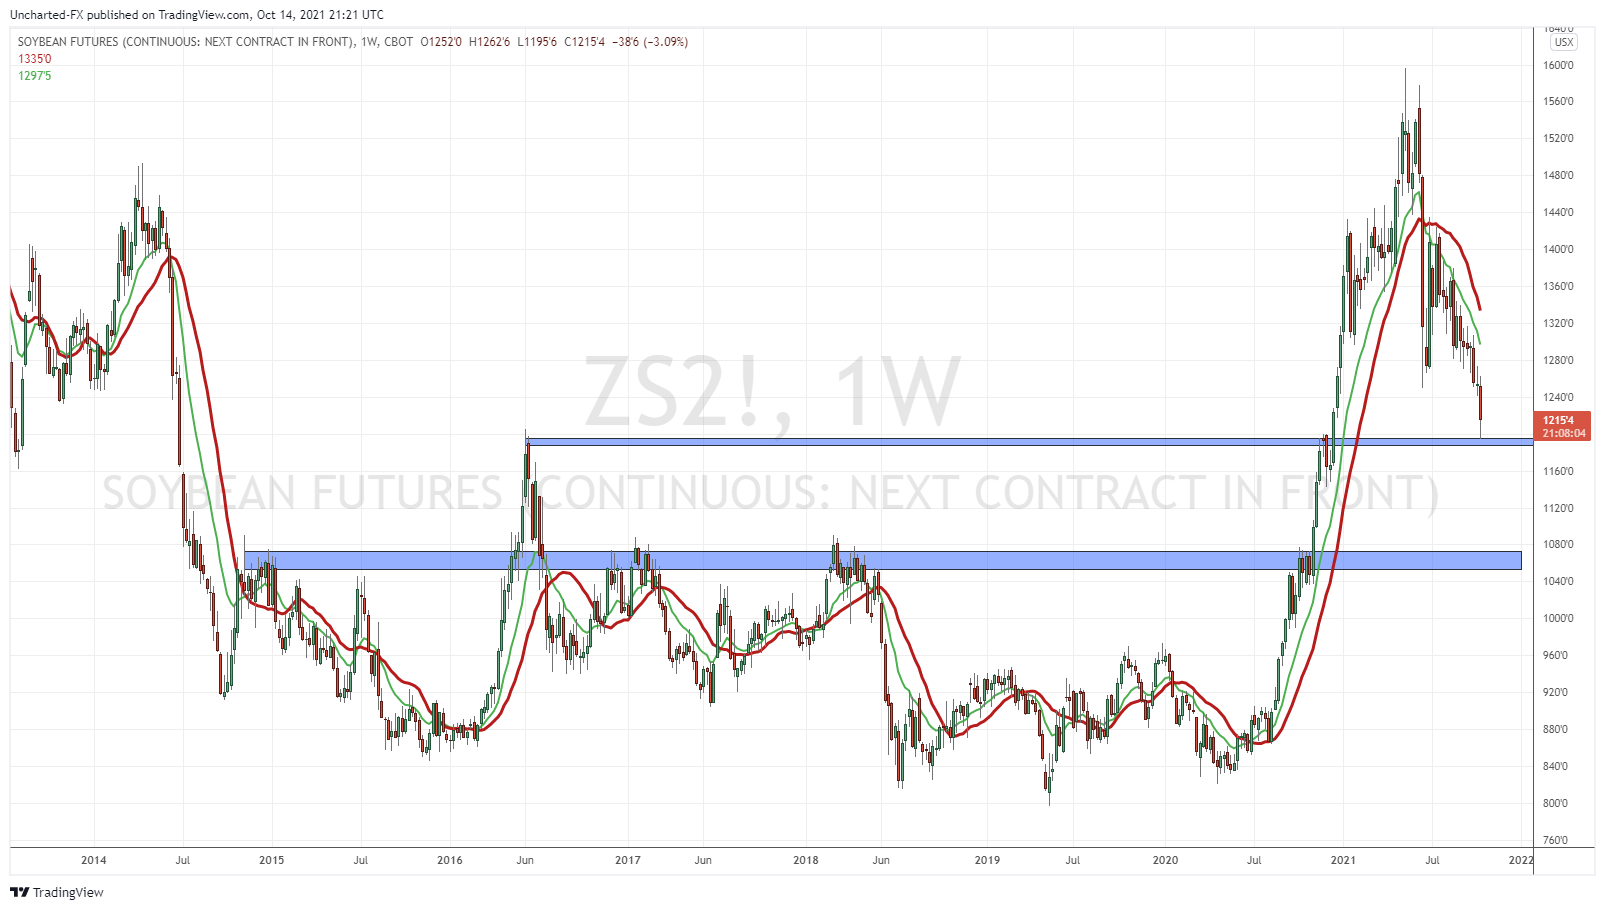
Soybean themselves aren’t looking too great. We are down -8.03% year to date, and things could turn more red. We broken down below 1280, and now we are testing a major support zone. To turn back bullish long term, we want to see a close back above 1280. We breakdown here, then a move lower to the 1070 zone is coming. Just like the chart of Corn, that would be a retest of the major weekly breakout this year.
So I hope this was helpful and informative. The charts are great, but I find it rewarding and fulfilling to know the possible fundamentals behind the supply and demand mechanisms. For those wanting to be up to date on chart moves, be sure to visit our site daily for a Market Moment post, and join our Discord channel where I post charts and market moving news on a daily basis. Next week I will continue highlighting specific agriculture and agriculture stock news, as well as interesting looking charts. What I am thinking is to do individual deep dives on specific Agriculture companies breaking down their financial statements, charts, and their value proposition.

