I have been asked to analyze a few crypto charts from followers on Twitter. Ask and you shall receive! In this Market Moment, I will look at the current technical set ups on Dogecoin, Cardano and SingularityNET.
Before we do so, here are a few headlines from the cryptocurrency space:
Visa has bought an NFT. Buying a CryptoPunk for $150,000. Here are some comments from Visa’s head of Crypto Cuy Sheffield:
“We think NFTs will play an important role in the future of retail, social media, entertainment, and commerce,”
“To help our clients and partners participate, we need a firsthand understanding of the infrastructure requirements for a global brand to purchase, store, and leverage an NFT.”
“With our CryptoPunk purchase, we’re jumping in feet first,”
“This is just the beginning of our work in this space.”
Hinting at some more purchases down the road.
MicroStrategy bought 3,907 more Bitcoin at a price of $45,294. As a result, the company now owns around 108,992 Bitcoin at an aggregate total of $2.918 Billion and an average purchase price of $26,769.
Finally, Coinbase has said that it will be buying $500 million worth of crypto, and will invest future profits into a crypto portfolio:
The company plans to invest in “Ethereum, Proof of Stake assets, DeFi tokens, and many other crypto assets supported for trading on our platform,” finance chief Alesia Haas said in a blog post.
Technical Tactics
Before we breakdown the three coins, let’s take a look at Bitcoin first as a lot of crypto moves are still correlated with the top crypto.
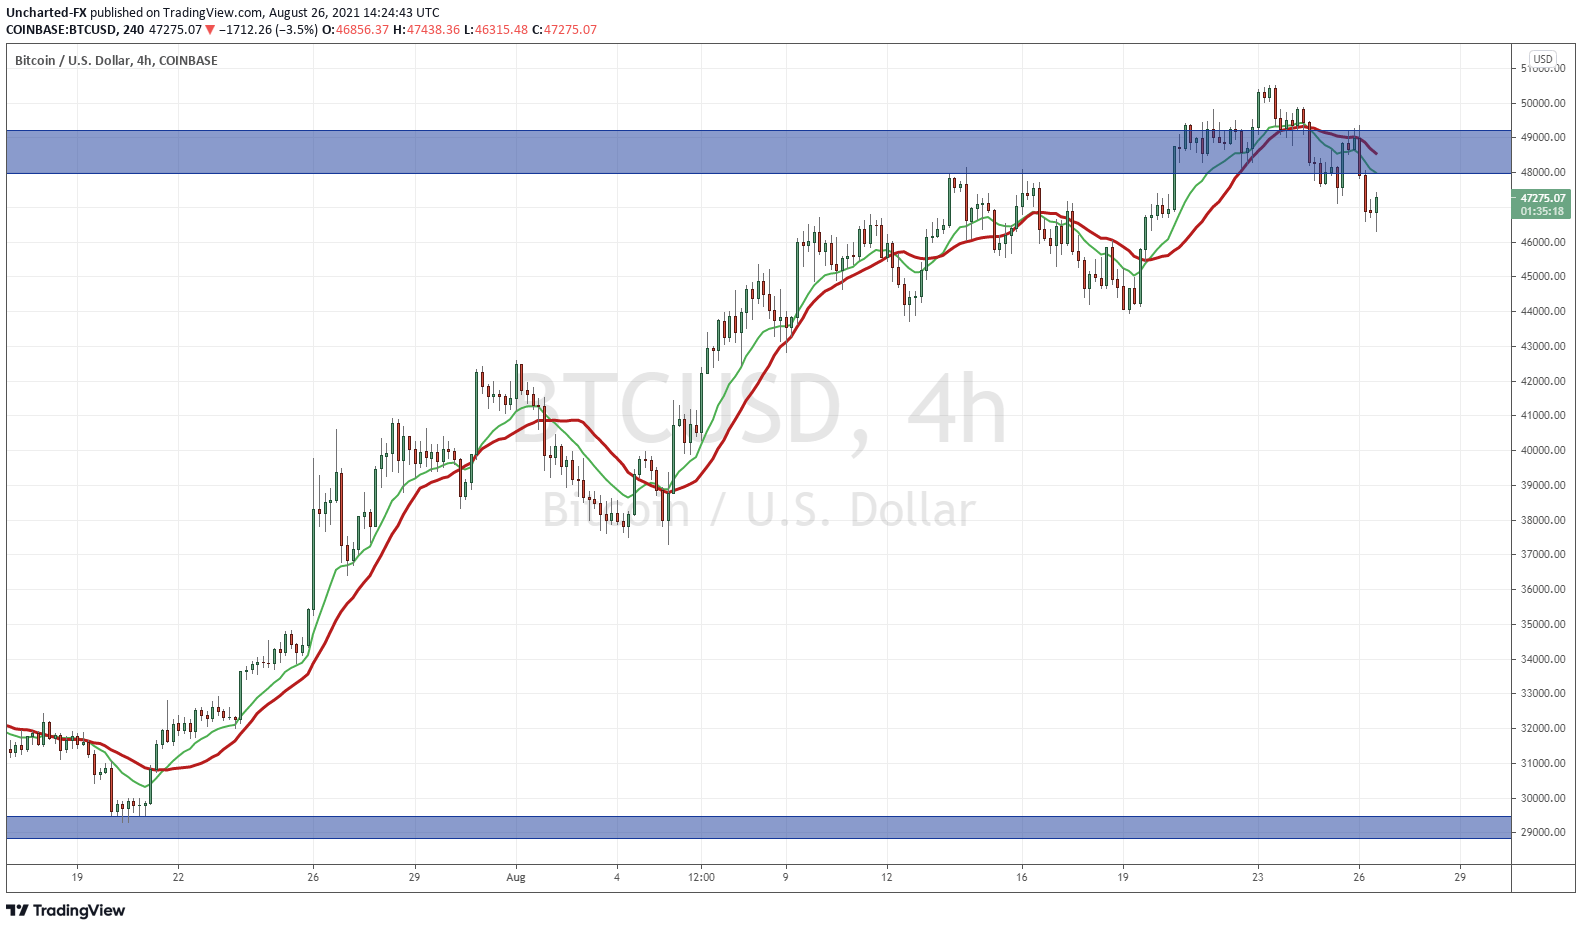
I first want to show you the 4 hour chart. What you need to know is that the $50,000 remains an important resistance zone. Sellers stepped in, and on the 4 hour chart, have taken price below a flip zone of $48,000. Going forward, I want to see Bitcoin close back over $48,000. If it doesn’t, it may just retest it and then sell off creating a lower high. I must admit, on the 4 hour chart it seems like Bitcoin wants to make a leg lower which would impact the other crypto’s.
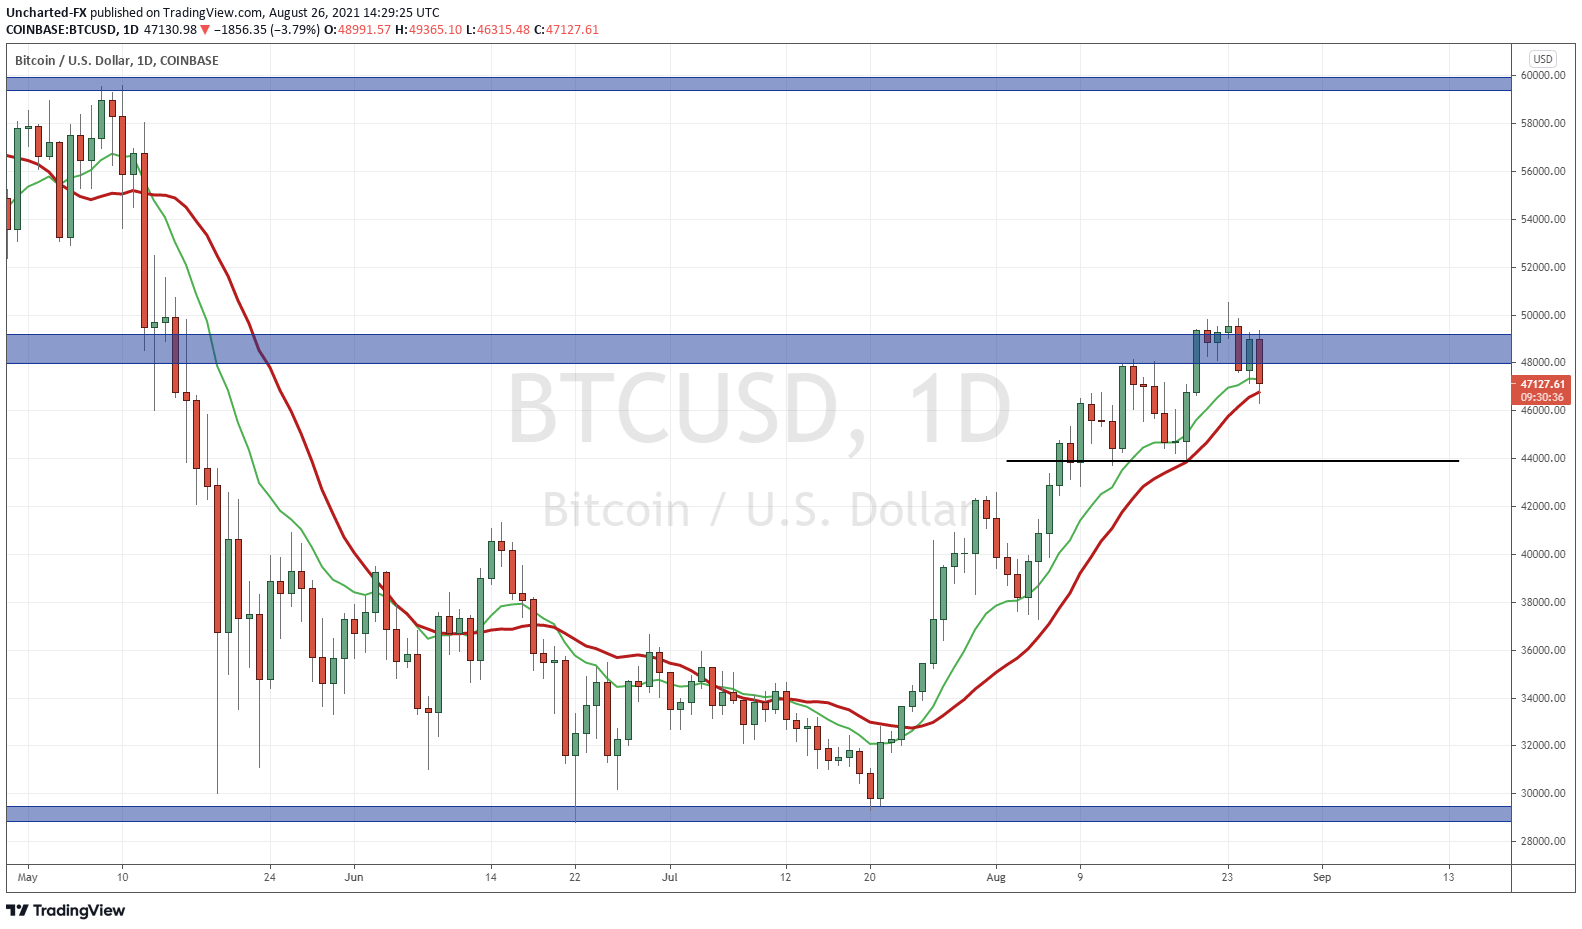
Above is the Daily chart of Bitcoin. You can see how important the $50,000 zone is. We had 6 trading days to try and break above it, but sellers were persistent. A few positive signs are that we are testing my moving averages right now. This acts as support, and you can even draw an uptrend line but it would appear pretty much where my Moving Average is so I have elected not to.
You can see I have a line at $44,000. This is the last higher low swing in the uptrend. According to market structure, as long as we remain above this higher low swing, the uptrend is intact.
So how do we combine all of this? If on the 4 hour, we reject $48,000 then chances are we will be moving down to $44,000…and then from there, we could be setting up for a head and shoulders reversal pattern. If we close back above $48,000 then the uptrend keeps going, and we would hope to see a nice strong close above $50,000.
Dogecoin
I recently analyzed Dogecoin and how Mark Cuban jumped on Team Doge. However the major news I covered was the technical break. We broke above the $0.29-$0.30 zone with a nice strong green candle. I was hoping to see some follow through, but that did not happen. That’s okay, if we don’t see momentum, then we can expect to see prices pullback to retest the breakout zone. It happened…and it is happening again.
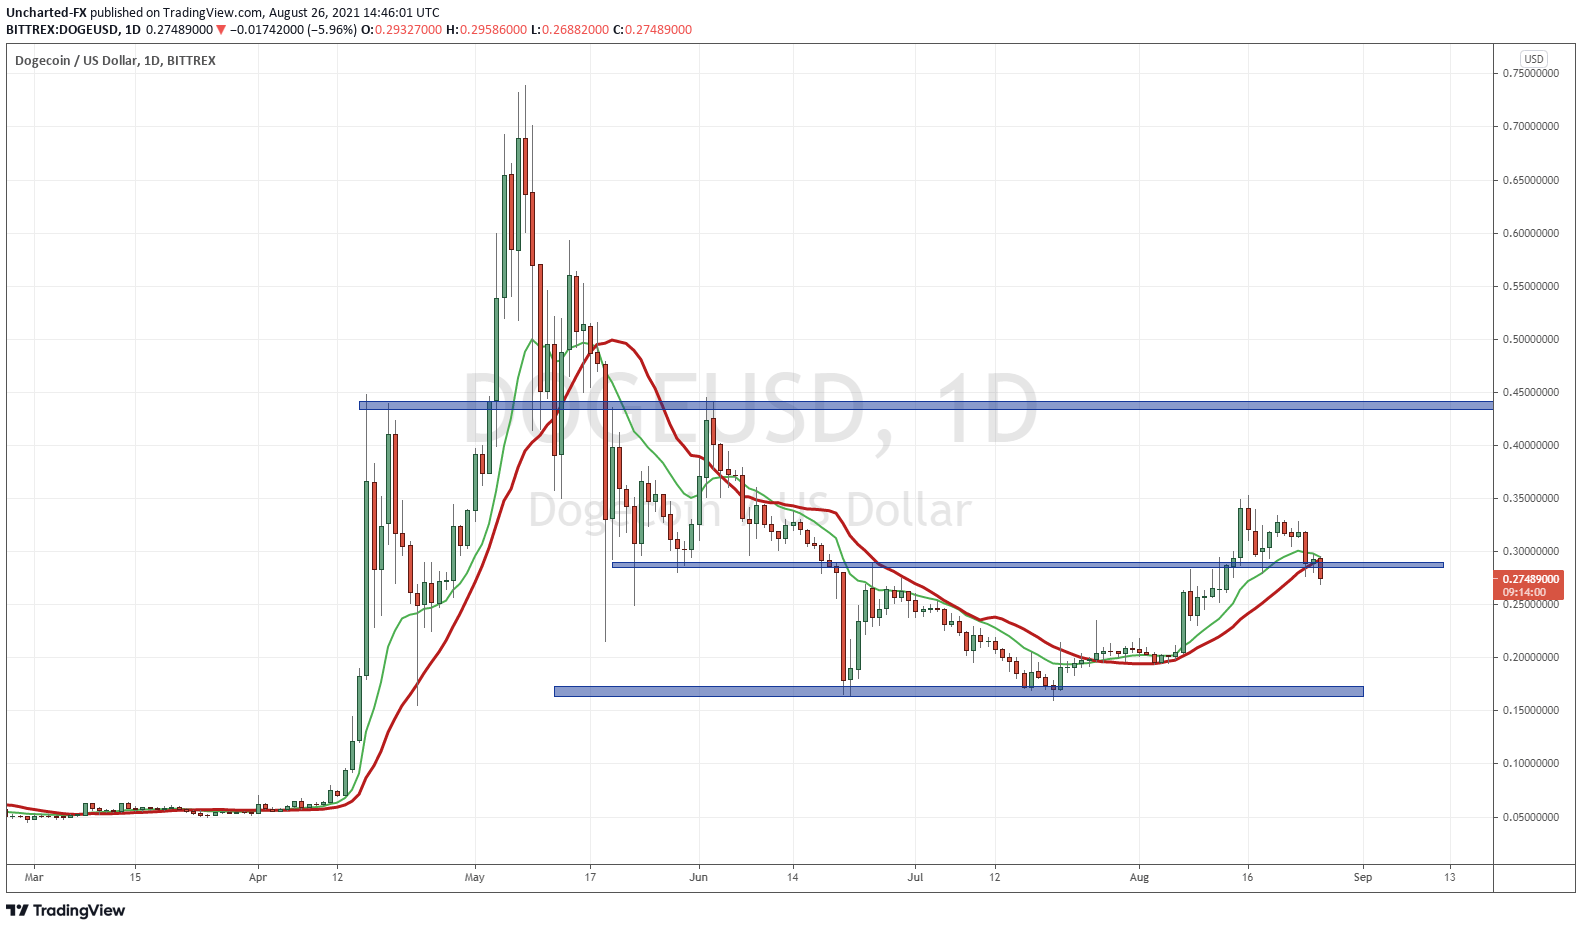
You can see from the initial retest of support, we bounced slightly. Not momentum and we couldn’t take out recent highs. A lot of this has to do with Bitcoin struggling at $50,000 in my opinion. We are now retesting support again. And it is not looking too good right now. If we get a daily close like the red candle we have today, it would be below our support. Sure, we can maybe fake out tomorrow and see prices climb back above, but a close like this would be a breakdown. Let’s watch to see how this closes today and if buyers can defend. I expect buyers to put up a good fight here.
Cardano
Some of you may recall our take on Cardano. In a previous Vishal and Co show, our Crypto expert ( dare I say…our Master of Coin) Joseph Morton named Cardano as one of his top three long term crypto picks. Polkadot and Stellar Lumen were the others. The crypto is definitely popular, some calling it the Ethereum killer. Joseph primarily chose coins that were second gen, or coins that are similar to current first gen coins but do it faster and more efficiently. The one thing Cardano is lacking is the ecosystem like Ethereum, but this is why this is a long term bet.
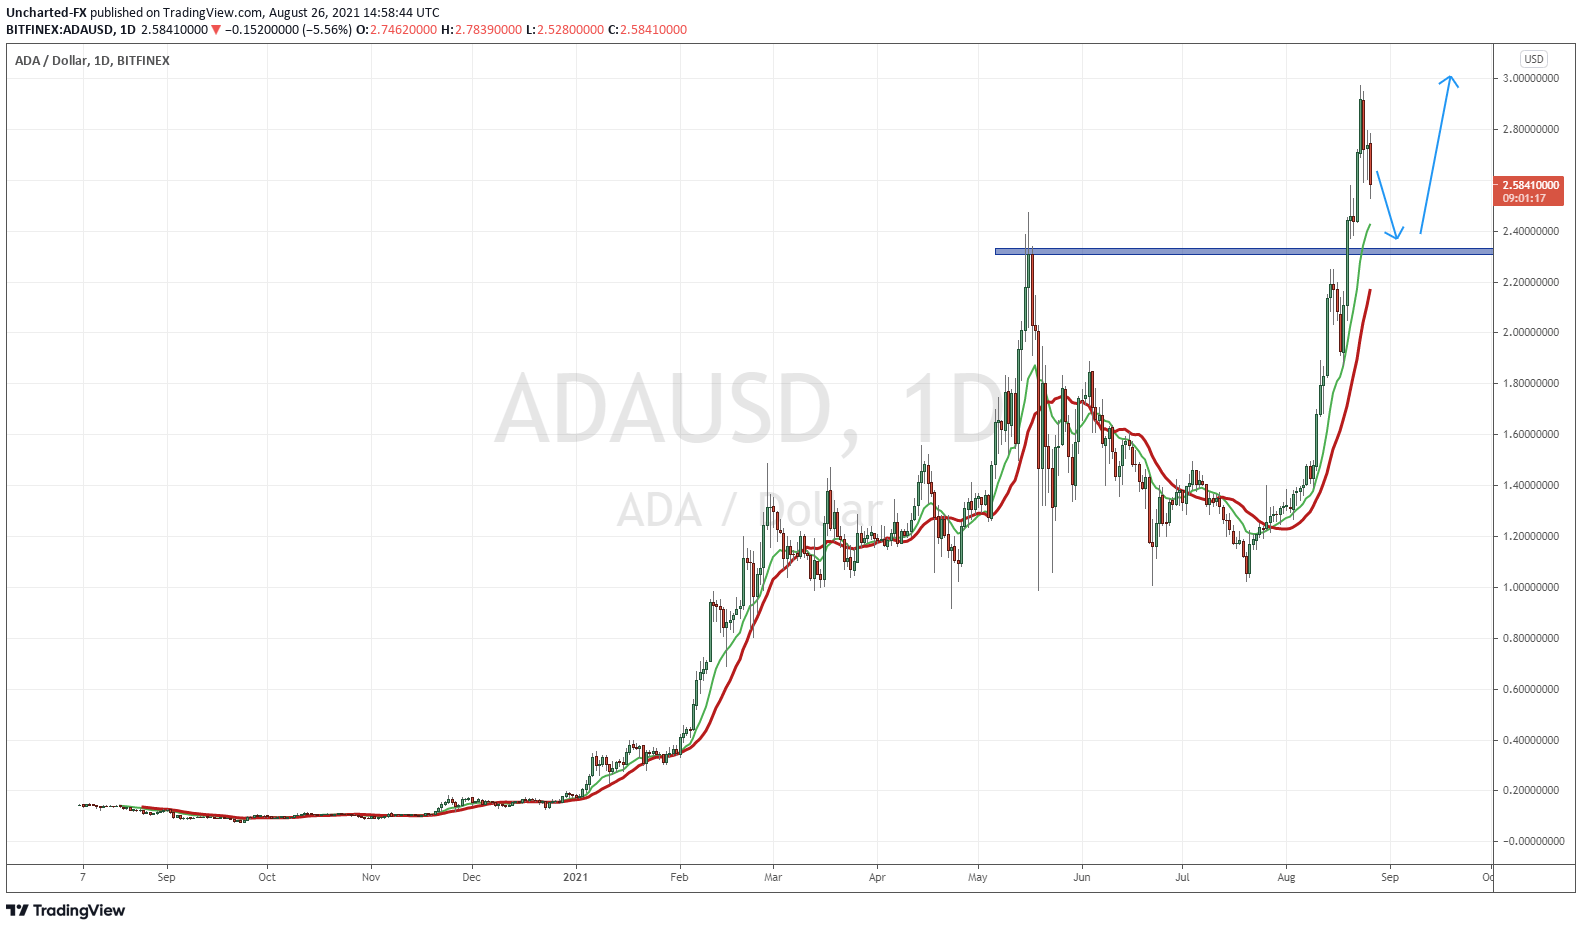
Above I have the daily chart of Cardano. Can you take a guess to why it was trending on social media? It was because it broke into new record high territory. Cardano broke and closed above $2.30 with a nice green candle close. Momentum took us higher to just under $3.00 before seeing this current pullback.
I have drawn my blue lines forecasting typical breakout structure. We breakout and then price pullsback to retest before continuing higher. I will be watching the $2.30 zone going forward.
But I want to show you something a bit different…
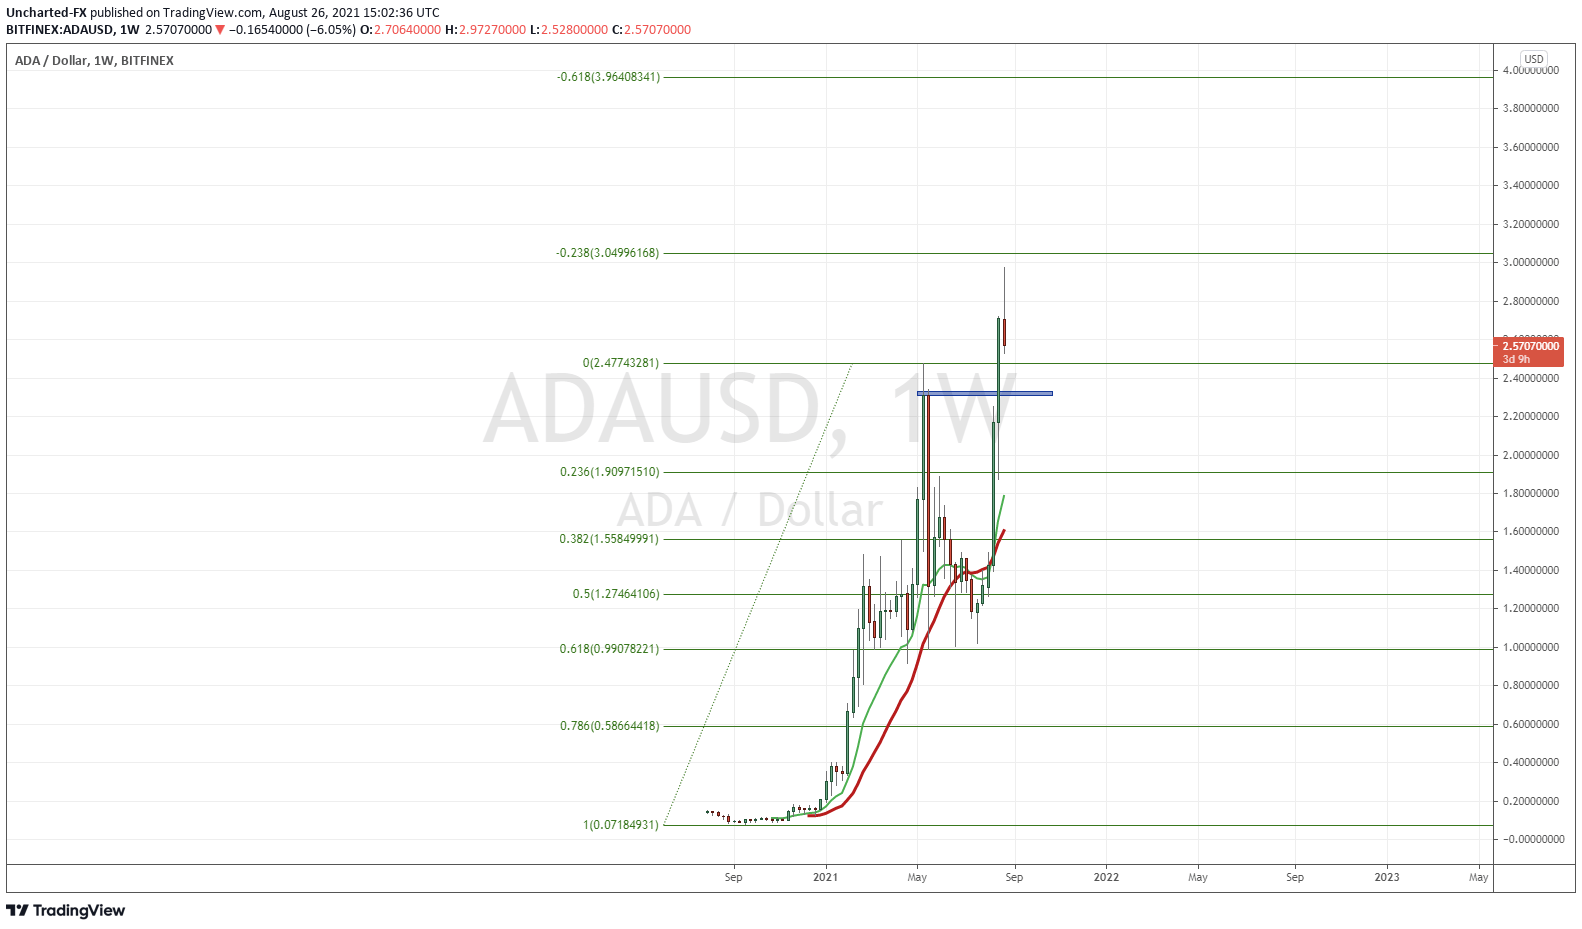
When price is in uncharted territory, traders often wonder where resistance could form. One way is to target whole numbers or important psychological areas. Another way is to do what I have done above. I used the fibonacci tool. Connecting the lows the the previous highs. What caught my attention is how prices reacted at the 0.618 or the 61.8 zone. For those unfamiliar with fibonacci, the 61.8 fib level is seen as the key. Price will pullback at most to this level if it wants to continue the uptrend. We did, and we sure did continue the uptrend.
Fib extensions are our price targets. You can see price sold off close to my $3.04 price target. Above this would be $3.96. This is where we should expect prices to hit before pulling back. We can say the first fib target has pretty much been met, hence the pullback.
Once again, I stress Cardano is a long term hold. This breakout into new highs is huge, and if the bull market in crypto continues, we will see higher prices.
AGIX/SingularityNET
I must admit, I was pleasantly surprised to see AGIX was SingularityNET. This project has been one I have been following since its early days. When I mean early days, the AI robot Sophia was listed as part of their team.
The project sort of freaked me out as it was being marketed as an AI to AI transaction coin. Looking at the site now, it seems it is more about the AI marketplace and monetizing AI services.
What is huge about this certain members of the team:

Dr. David Hanson is the founder of Hanson Robotics, the AI and robotics company that built Sophia. Dr. Ben Goertzel is seen as one of the leading AI experts in the world.
I am no way saying this is true, but back in the early days of Bitcoin, a lot of people thought Dr. Ben Goertzel was one of the only persons on Earth with the intellectual acumen to be Satoshi Nakamoto. Yup, things were like that in the early days. The other names floated out were Peter Thiel and Vitalik Buterin.
I guess what I am trying to say is this man is one smart guy.
If you believe AI is the future, watch this project. The founders are the leading AI experts in the world. Oh I must also say that there is a lot of chatter of these guys being on the Cardano, so if you are bullish Cardano, then really consider watching SingularityNET.
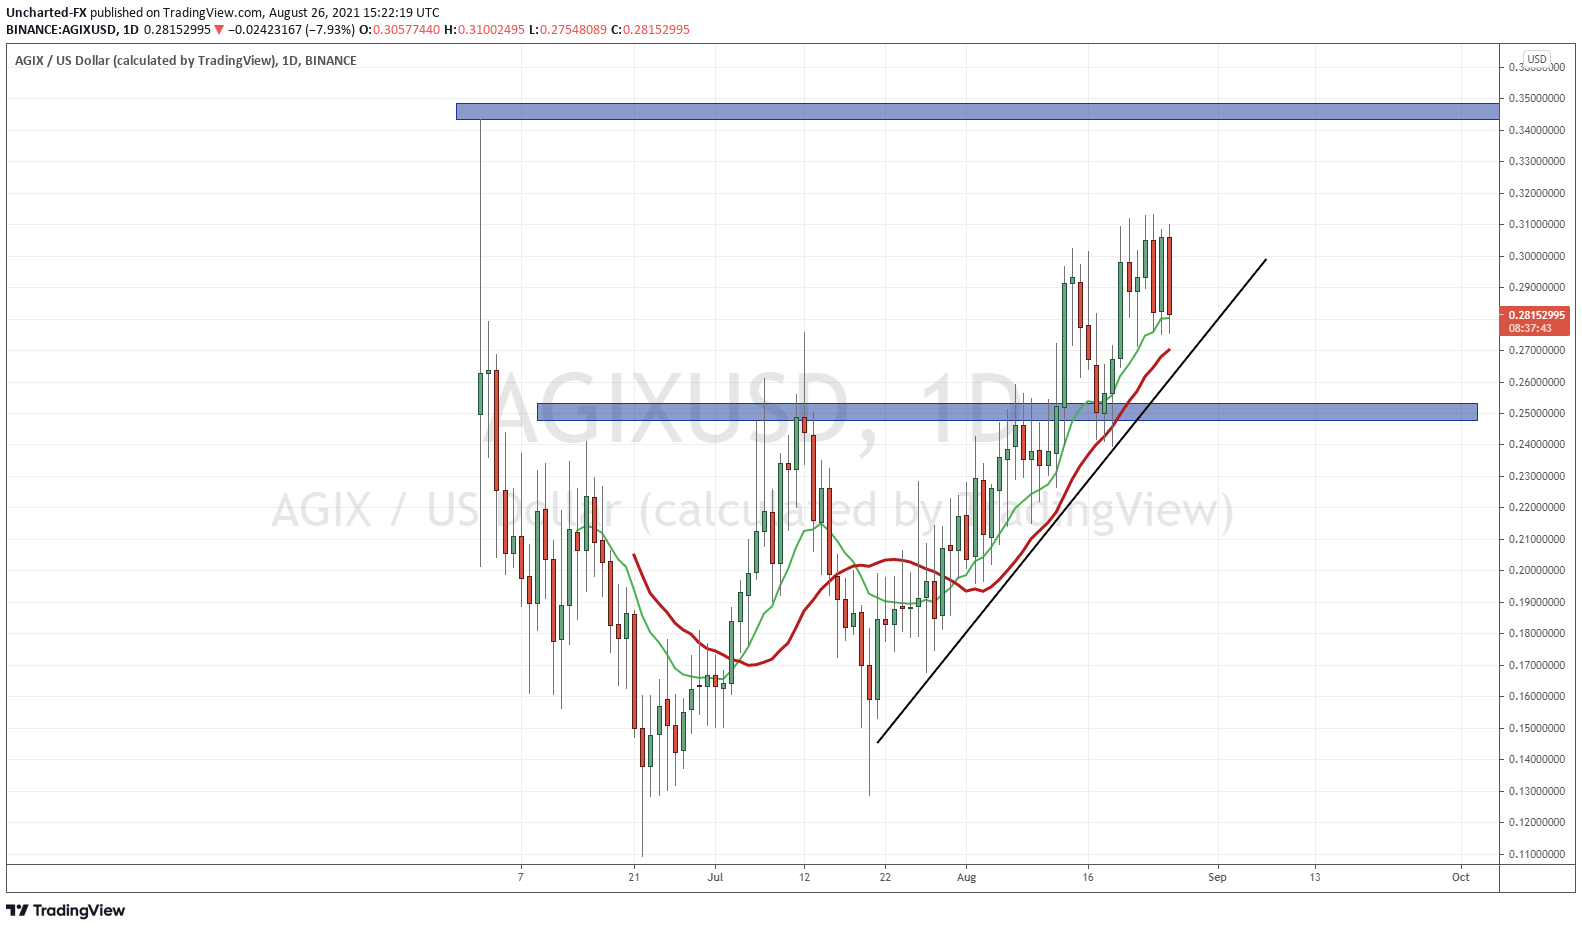
As I previously stated, I was pleasantly surprised to see SingularityNET was just recently released. I honestly thought they must have been trading years ago. But hey, this is exciting because it means I can still get in early with less than 3 months of price action so far!
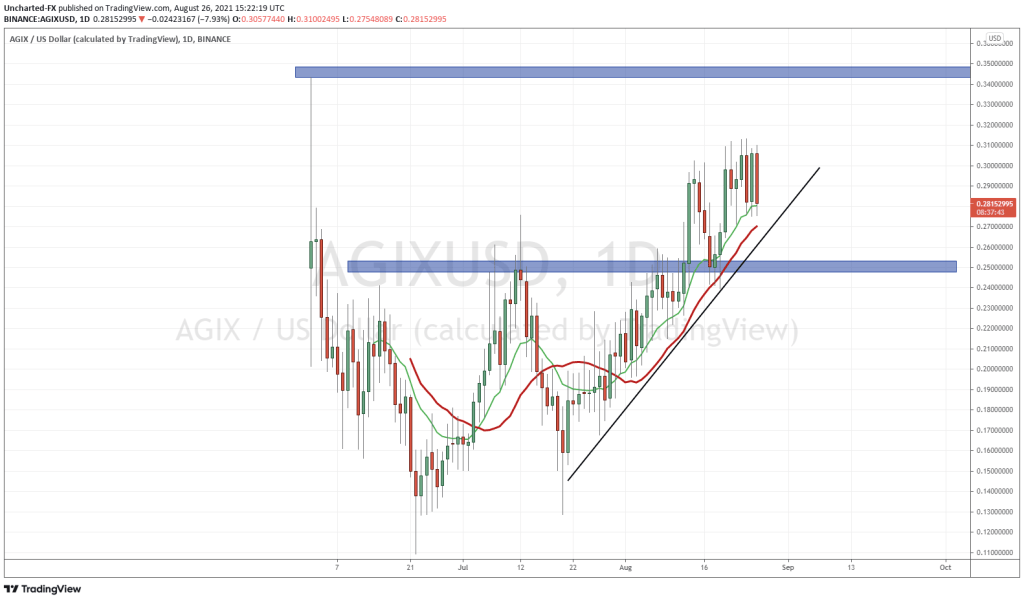
On the chart above, you can see AGIX is setting up nicely. Let’s begin at the bottom and work our way up. We have a broad double bottom pattern. We have an uptrend line being adhered to. More importantly, we broke above previous candle body highs, to make new record candle body closes when we closed above $0.25.
The close above $0.25 was strong, and we pulled back to retest this zone. After the retest, we took out recent candle body highs just a few days ago.
So these are our two levels: support at $0.25, and resistance at record highs at $0.34-$0.35. We break above that resistance zone and the party really gets started as we take out first day trading highs.

