Cryptocurrencies had a stellar weekend. Major technical levels were broken, and this week will determine whether we just see pullbacks, or if the larger intact uptrend remains. Many of the crypto charts look similar. In today’s Market Moment we will go over XRP. For my Doge Army followers, don’t worry, I will give an update on that tomorrow.
For those that prefer video format, I got you covered! This was recorded last week, and the technical level mentioned has been broken to the upside!
XRP had a wild 54% gain in one week. The crypto also hit a market cap of $60 Billion for the first time in three months. To be honest, I am seeing tons of headlines of “insert crypto here, hits market cap of _____ for the first time in three months!”. It just shows you we are at the beginning of a new uptrend cycle.
No news on XRP to create a move like this. Although some bears would still mention the SEC vs XRP ongoing battle.
The truth is there is a lot of divisive opinions about XRP. If you follow crypto’s, then I am sure you know this. People either hate XRP or love it. Me personally, I trade the nice charts. XRP is seen as the bankers coin, a centralized coin. Back in the day it was a valid argument. The whole idea of cryptocurrency in the first place was to be decentralized and away from big government, big corporations, and the big banks. With regulations on the crypto sector looking more likely, and central bank digital currencies on the way… crypto’s are moving away from their original mandate. I have hinted in the past that the crypto purists would move into De-Fi.
Technical Tactics
Crypto’s moved BIG so we should expect a pullback. It now depends on if buyers step in and defend the support retest. This will largely determine whether we continue this run or not.
Just a quick note: we are seeing the meme stocks (AMC, GME etc make moves). I have mentioned this in the past, but we see a pattern with small caps and cryptocurrencies. When crypto’s are red, we see a move into small caps and the meme stocks. When crypto’s are green, we see a drop in small caps and meme stocks. The small cap index I observe is the Russell 2000.
Keeping this correlation in minds, let’s first look at the Bitcoin chart. Many crypto’s still make moves following Bitcoin. There is not a divergence just yet…unless a guy like Elon Musk or someone tweets about a specific coin.

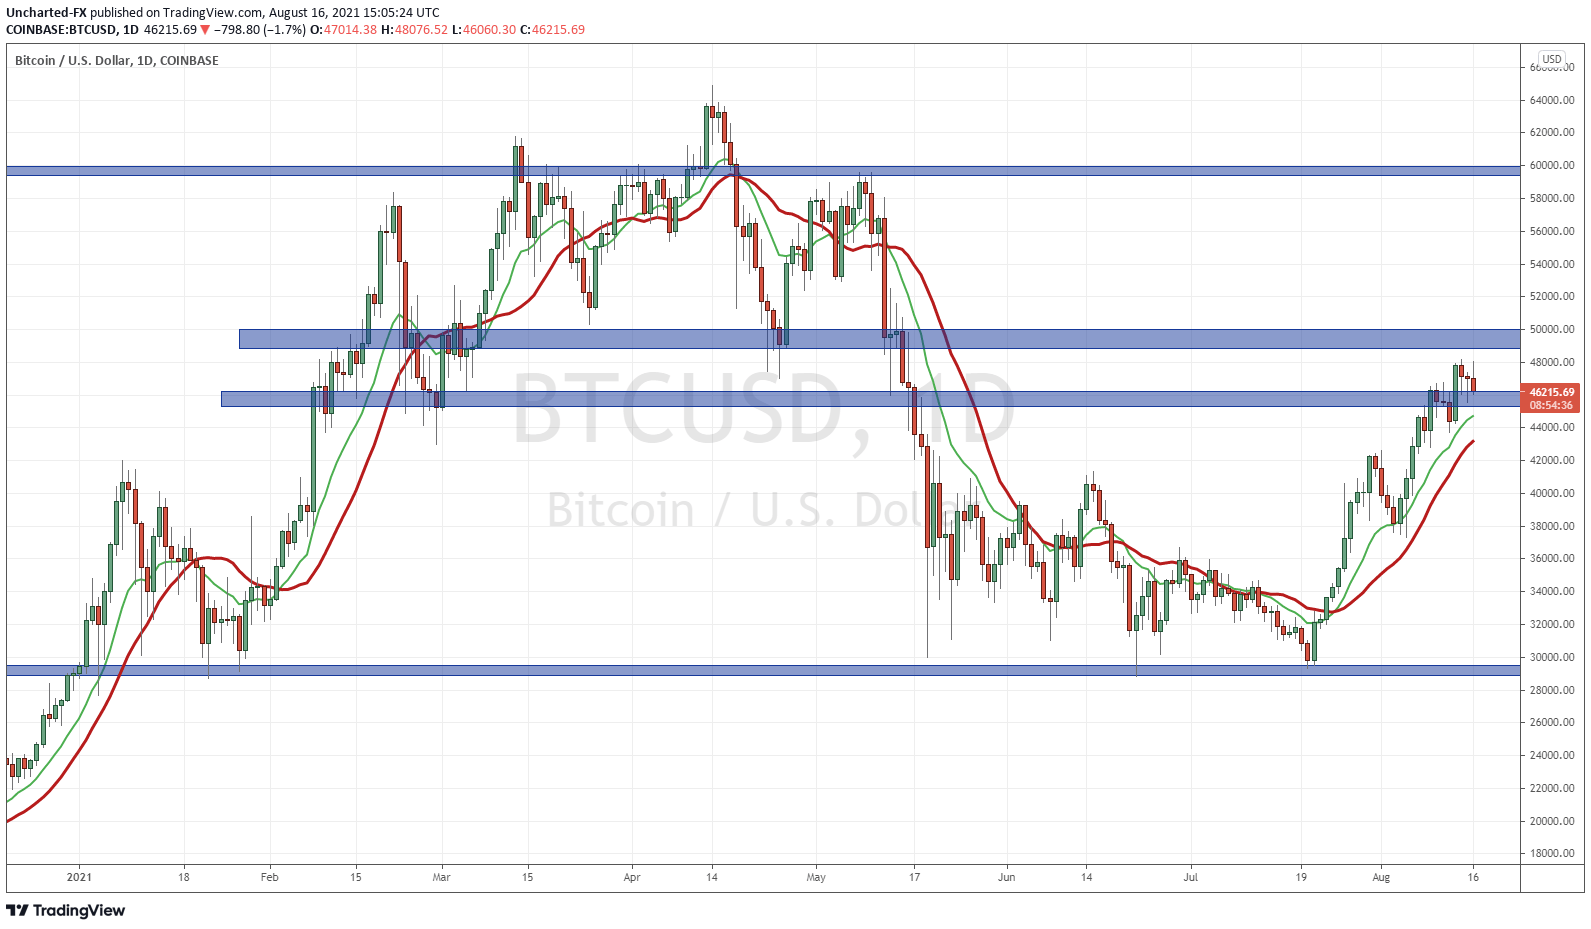
The daily chart of Bitcoin broke above a resistance zone at around the $46,000 zone. As you can see, there is also resistance at the psychologically important $50,000 zone just above. Technically, I could have drawn one large blue box between 46-50k. This is our zone.
Moving forward, we want to see the retest of $46,000 be met with a flood of buyers. This would mean the bulls are still in control. If we fall and close below 46k, it means people are taking profits on their trades, and the bears are getting the upper hand.

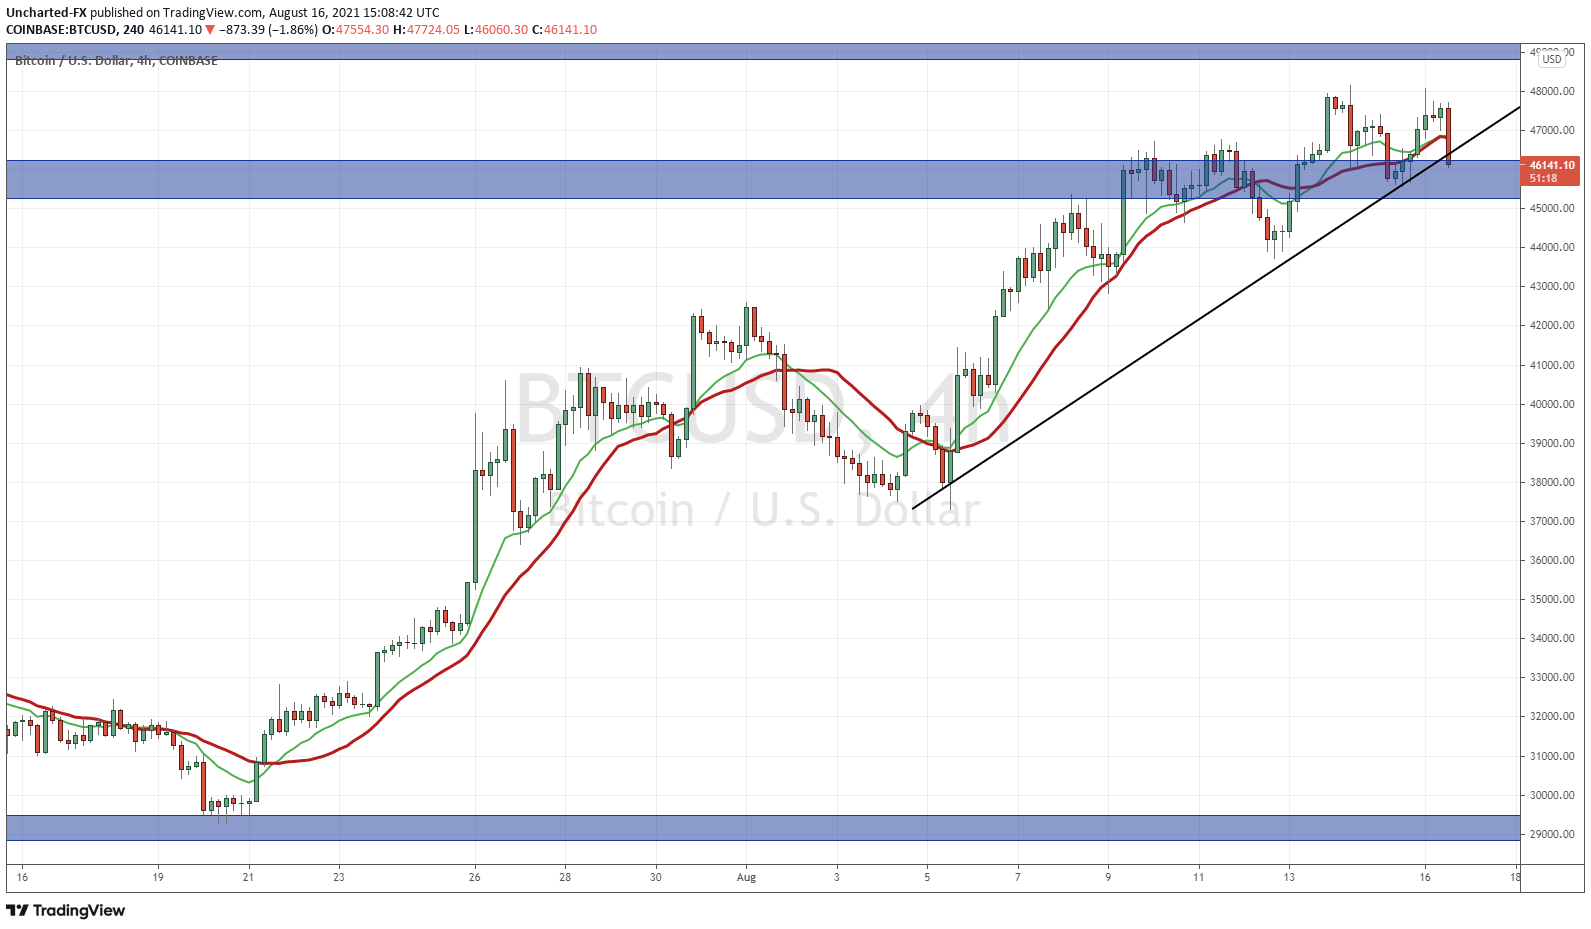
We can also take it down to the 4 hour chart for a better view. We have my uptrend slope line breaking, indicating a shift in trends. More importantly, take a look at the possible double top pattern. But once again, the confirmation and the short trigger is the break below the retest of support.
Onto XRP:

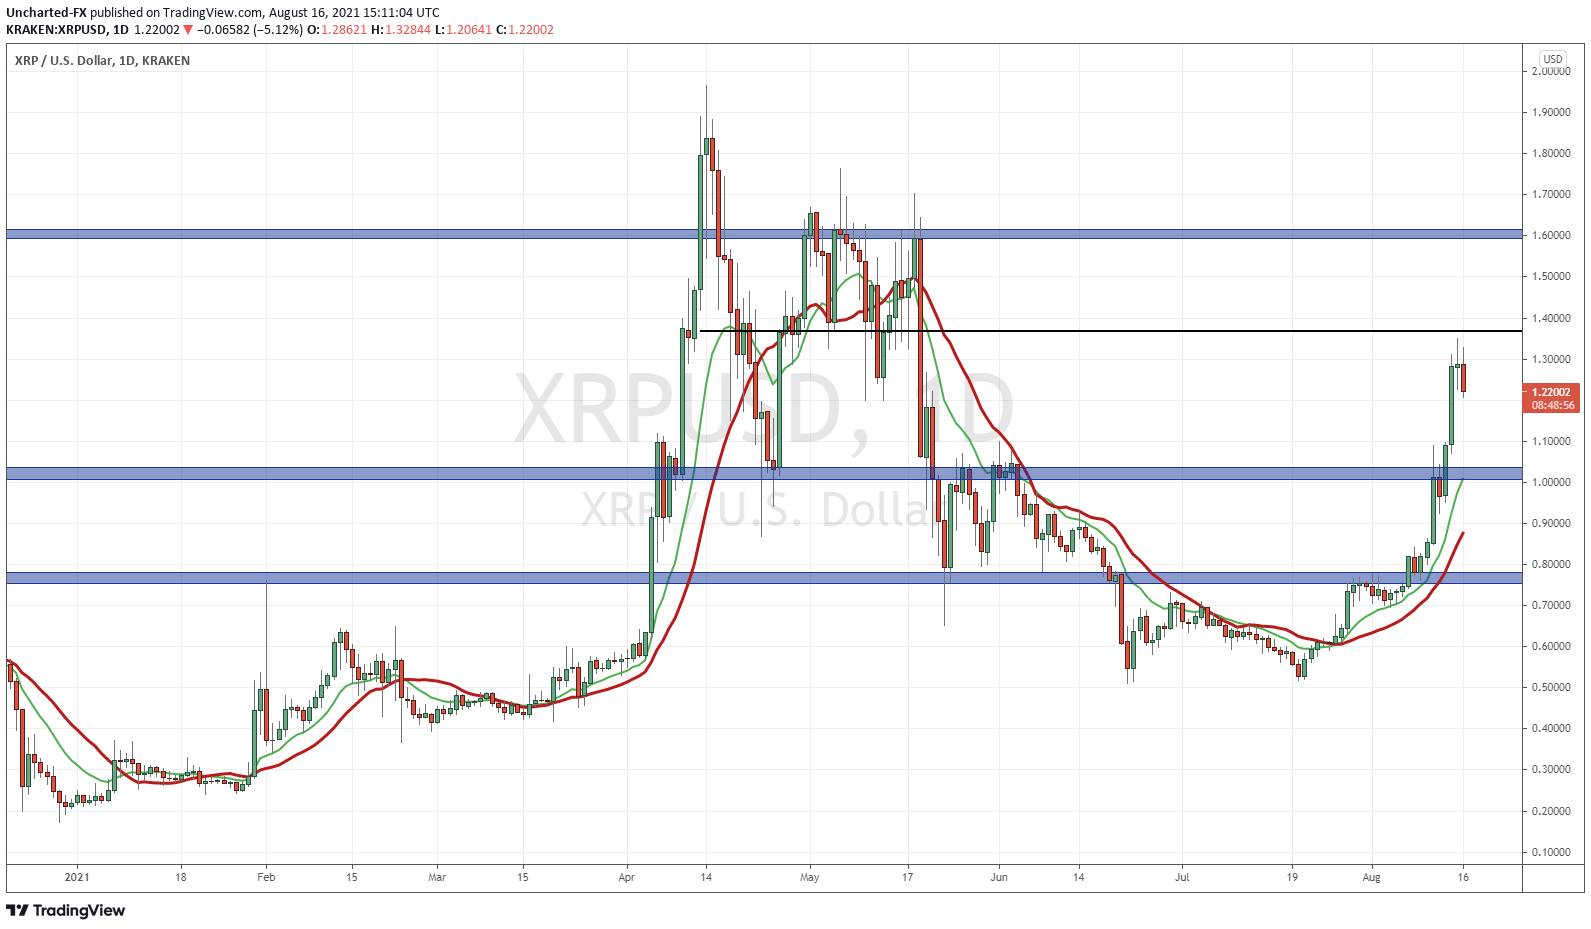
We scoped out the cup and handle pattern and breakout way back around $0.70. Our Discord members were notified of this breakout. $1.00 was our first target, being a resistance zone and important psychological number. We broke above that, and I actually have a major resistance next around $1.60.
You can see I drew a line just under $1.40. When I turned my chart into a line chart, this area does provide some interim resistance. Hence why prices stalled here. Candle wise, it appears that we are printing what is known as an evening star pattern.
The chart looks a bit better in terms of maintaining an uptrend. The $1.00 zone is our key. As long as prices remain above it, we are still in an uptrend. We could see a pullback to $1.00, especially if Bitcoin tumbles after breaking below $46,000. If not, another higher low, and the move to $1.60 is in the cards. What I will be doing is watching the 4 hour charts of both Bitcoin and XRP. If I see breakdowns, we are likely to pullback to retest $42,000 and $1.00. If not, then the chances of continuation and a higher low is very high.

