

Being a technical trader who focuses on trend reversals, one of the key signs that I look for is the exhaustion of the current trend. What do I mean by exhaustion? Simple. No more higher highs in an uptrend, and no more lower lows in a downtrend. Rather price begins to range. This usually occurs at major support (price floor) and resistance (price ceiling) levels. Furthermore, the final confirmation of a reversal comes in the form of popular chart patterns. These patterns are the double top, double bottom and the head and shoulders pattern. Now that my readers know this, I have seen signs in the US Stock Markets which indicate a possible topping and reversal.
I say possible because the trigger to confirm the pattern, and thus the reversal, is always the break down. This will make more sense when I cover the charts of the S&P 500, the Nasdaq and the Dow Jones below.
Let us cover the fundamentals to gauge what is more likely. Will we be getting a Stock Market topping pattern? Or are we setting up for a blow off top taking us to new highs and continuing the rally forward?
Let us first cover the arguments for topping.
Many analysts are warning about the speculation in Stock Markets. They have been for sometime. How many times have you heard the word “bubble” lately? I was not old enough to trade the dot com bubble, but from people who I have talked to that did, they are saying the markets today remind them of that period of time.
What we have seen with the WallStreetBets crowd and the influx of retail traders is of importance. Plenty of Stock Market analysts say that the sign of a market top and a market crash is when an influx of the retail crowd begins to jump in. Contrary to popular belief, Wall Street does enjoy new retail money. We have seen an example of this last week and this week with the WallStreetBets short squeeze stocks such as Gamestop and AMC. New money is inexperienced and emotional, and Wall Street loves creating traps to get the retail crowd to take losses.
The Democrats taking the White House and the Senate was also seen as bearish for the Stock Markets. More so because of the increase in corporate taxes and regulations that are expected. We are still in the first 100 days of the new https://e4njohordzs.exactdn.com/wp-content/uploads/2021/10/tnw8sVO3j-2.pngistration, and currently they seem to be occupied with the pandemic and vaccines.
What about the real economy? Many know the economy is still in rough shape and that the Stock Markets are not adhering to reality. We have talked about this in the past: the real economy and the Stock Market are completely different. This is a good segway to cover why we are likely to make a blow off top.
As the real economy implodes, more crazy fiscal and monetary policy have been implemented. In fact there is more to come. Money printing will not and cannot stop. In this environment, the Stock Market becomes the only place to go for yield. In the past, I have even outlined why pension funds are likely buying stocks. They need to bring in a return of 8%, and they cannot do this anymore by holding bonds. The truth is that if Stock Markets were to have a significant fall, this could spark a crisis in pensions and retirements.
This brings in the Central Banks. In the case of the US, the Federal Reserve. The Fed has told us that they will keep interest rates lower for a long time. Let’s be honest, with the amount of debt out there now, can we really raise interest rates? The Japanese and Europeans are in negative interest rates and many analysts say that they can never hike rates by even a miniscule amount of 25 basis points. Due to the debt there, a small hike would endanger the system. Knowing this, Stock Markets still remain the place to go for real yield.
The Fed has also told us that they are purchasing bonds and junk bonds. That their asset purchasing program remains intact. The market wants to hear the words “the asset purchasing program is increasing”. It will be music to the markets ears, and guess what? I think the market is expecting this to happen. We are not at Bank of Japan of Swiss National Bank levels in which those two central banks either buy ETFs or stocks, but is that next? Those who bring up the Federal Reserve’s Plunge Protection Team (PPT) think this is already the case. The Fed cannot allow a significant drop in the Stock Market because of the issues it will cause especially on the pension side.
So in summary, it appears as if nothing will be able to bring these markets down UNLESS it is some sort of major black swan event.
My readers, and those are are a part of Equity Guru’s Discord Trading Room, know that I look at one thing to determine where markets are going: the 10 year yield.

When the 10 year yield is moving higher, it indicates that money is leaving the safety of bonds and is going elsewhere. That money is not going to money heaven, but rather into US stocks…or perhaps commodities and even cryptos. But generally it is flowing into US stocks. Most funds follow the asset allocation model. A split between stocks and bonds and rebalancing when one is cheaper than the other.
Looking at the 10 year yield chart above, we are well above 1%. Price pulled back to retest the 1% level before continuing higher. A breakout looks imminent which points to further gains in the US Stock Markets.
To end this post off, I want to cover the main US Stock Markets and what I am seeing, and what levels I would look at for a topping confirmation. By the way, similar patterns are appearing in many equity markets. I see similar patterns on the TSX, the Nikkei, the German Dax, the French CAC, the Euro Stoxx and the Australia 200.

The S&P 500 is approaching previous highs, which now acts as resistance (price ceiling). The last time we tested these levels, price ranged here for 4 days before selling off. The sellers won the first battle.
There is a possibility of a double top pattern forming, or what looks like an “M” shape. This means we would reject this resistance zone again and make our way lower. Now this is important: the trigger for the topping pattern and the reversal would be a daily candle close below support at 3700 (the lower line I have drawn). I say break and close, because price could easily fall back to 3700 and then bounce up higher again, perhaps even forming a range between 3700 and previous record highs. If we get a daily close and break higher, then it is suffice to say that the uptrend continues.
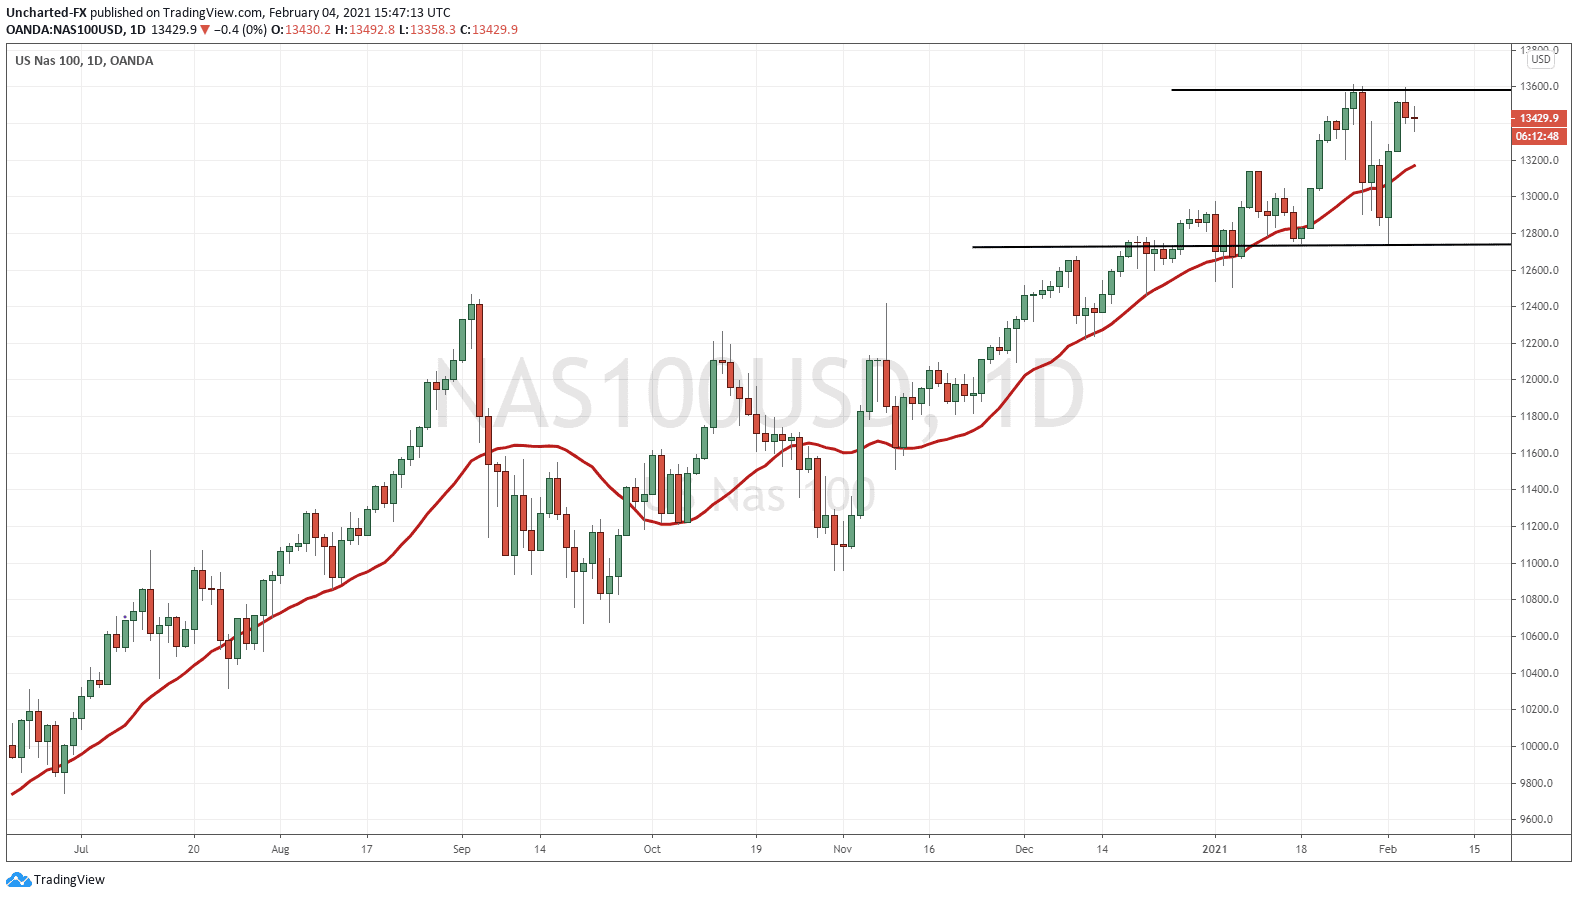
Not much more needs to be said about the Nasdaq. Similar set up as the S&P 500, and the possibility of a double top forming here if we reject previous all time highs. The support level I would be looking at would be the 12750 zone. A break below this zone triggers the reversal pattern.
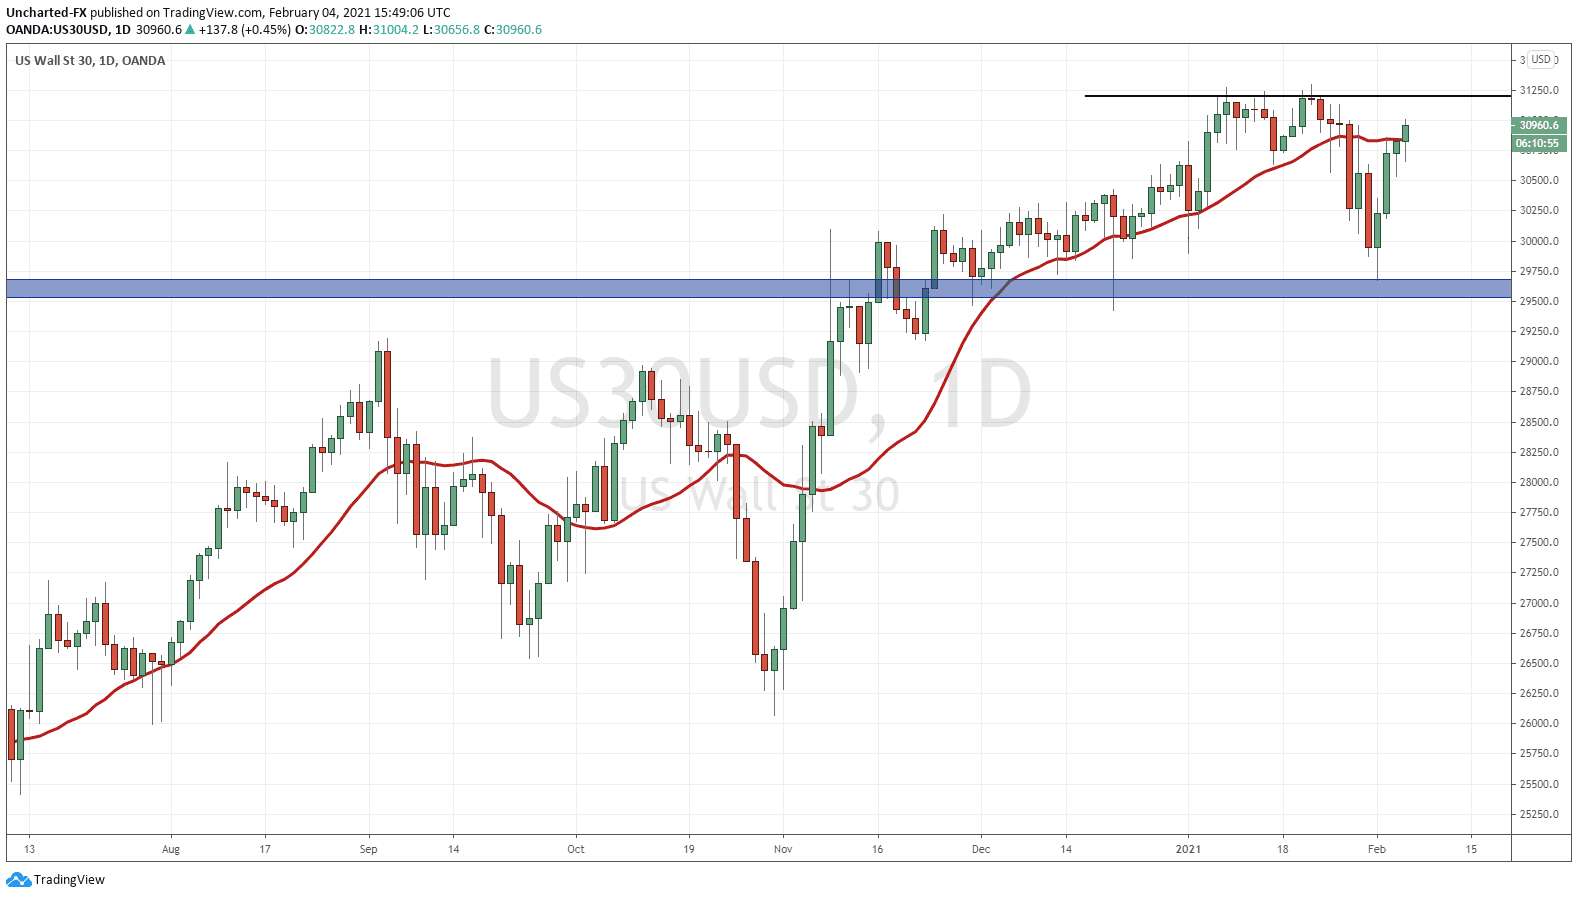
The Dow is the odd one out. We still have some room to the upside before we get close to test previous record highs. Also, in the case of the Dow, a rejection would not cause a double top, but a triple top pattern!
The downside support I would look at would be the 29,500 zone. Keep an eye on 30,000 too. A very important psychological number.

As I am finishing up writing this Market Moment post, I see this. The US small caps Russell 2000 chart. So as you can see, instead of rejecting the resistance and forming a double top, we are breaking out! Now we still have plenty of hours left in the trading day, and the candle could CLOSE back below the 2167 zone. Which would set up a double top pattern. But as of now, we have strong price action.
The reason why I bring up the Russell 2000, is because many times in the past, we have seen the Russell LEAD the major indices. Essentially, the Russell acts first, and the other 3 major indices follow it to catch up.
The price action on the Russell is exciting, but I still would like to see that 10 year yield break out to indicate more Stock Market strength.
Watch these resistance zones on all the major Stock Market indices for the next few days. I am not writing off a Stock Market top, but most things seem to be pointing to a blow off top and new highs. I don’t think the party is over just yet.