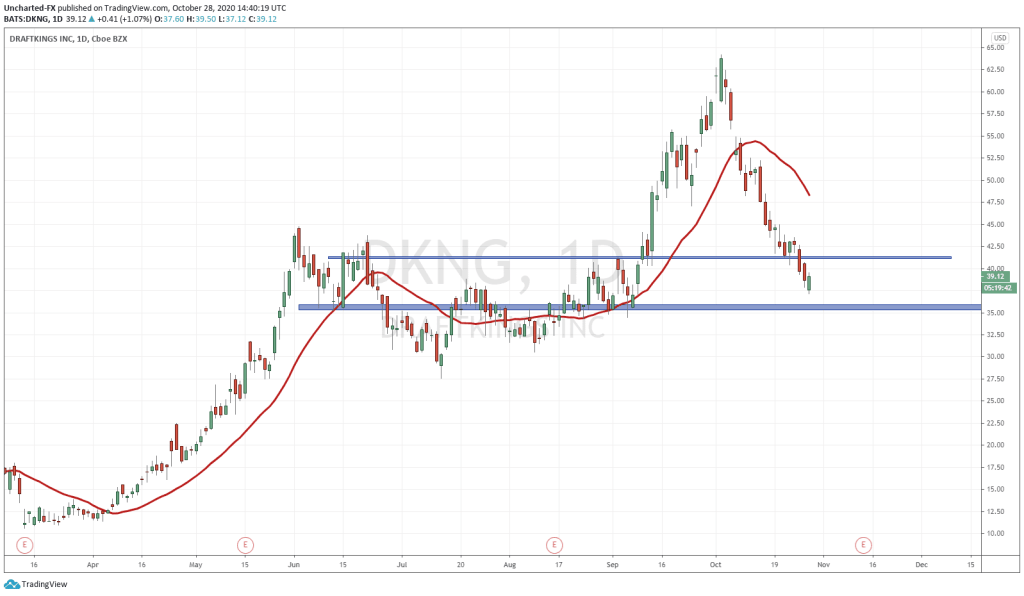
Draftkings (DKNG) has been one of the darlings on Wall Street with a rally of 322.90% year to date! The chart went parabolic, and it is hard to imagine the stock was trading at $11 back in March of this year, to the highs of $64.19 in the first week of October.
Yesterday, Draftkings reported a sports betting partnership deal with Turner Sports and FanDuel. The stock did not react positively, but this probably has to do more with the broader market sentiment. Indices were moving on headlines regarding a stimulus package, but today as I am writing this, markets are showing a strong green candle and momentum. Draftkings is not following suite.
This is where my technical approach comes in handy. I do believe that most news is already priced into markets weeks or even months in advance. It really is unexpected black swan type events which have not bee priced in, which causes markets to react violently. In this sense, reversal or bottoming patterns are the most powerful tool in our toolkit as they point out a turning of sentiment.
My readers know that one of the most powerful reversal pattern during an uptrend is a head and shoulders pattern. It looks just as it sounds: the middle of the chart protrudes out like the head, and then you have the left and right shoulder beside it. In technical jargon, it shows us the shift from one trend to another because it displays a higher low (uptrend) transitioning to a lower high (downtrend). Very powerful.
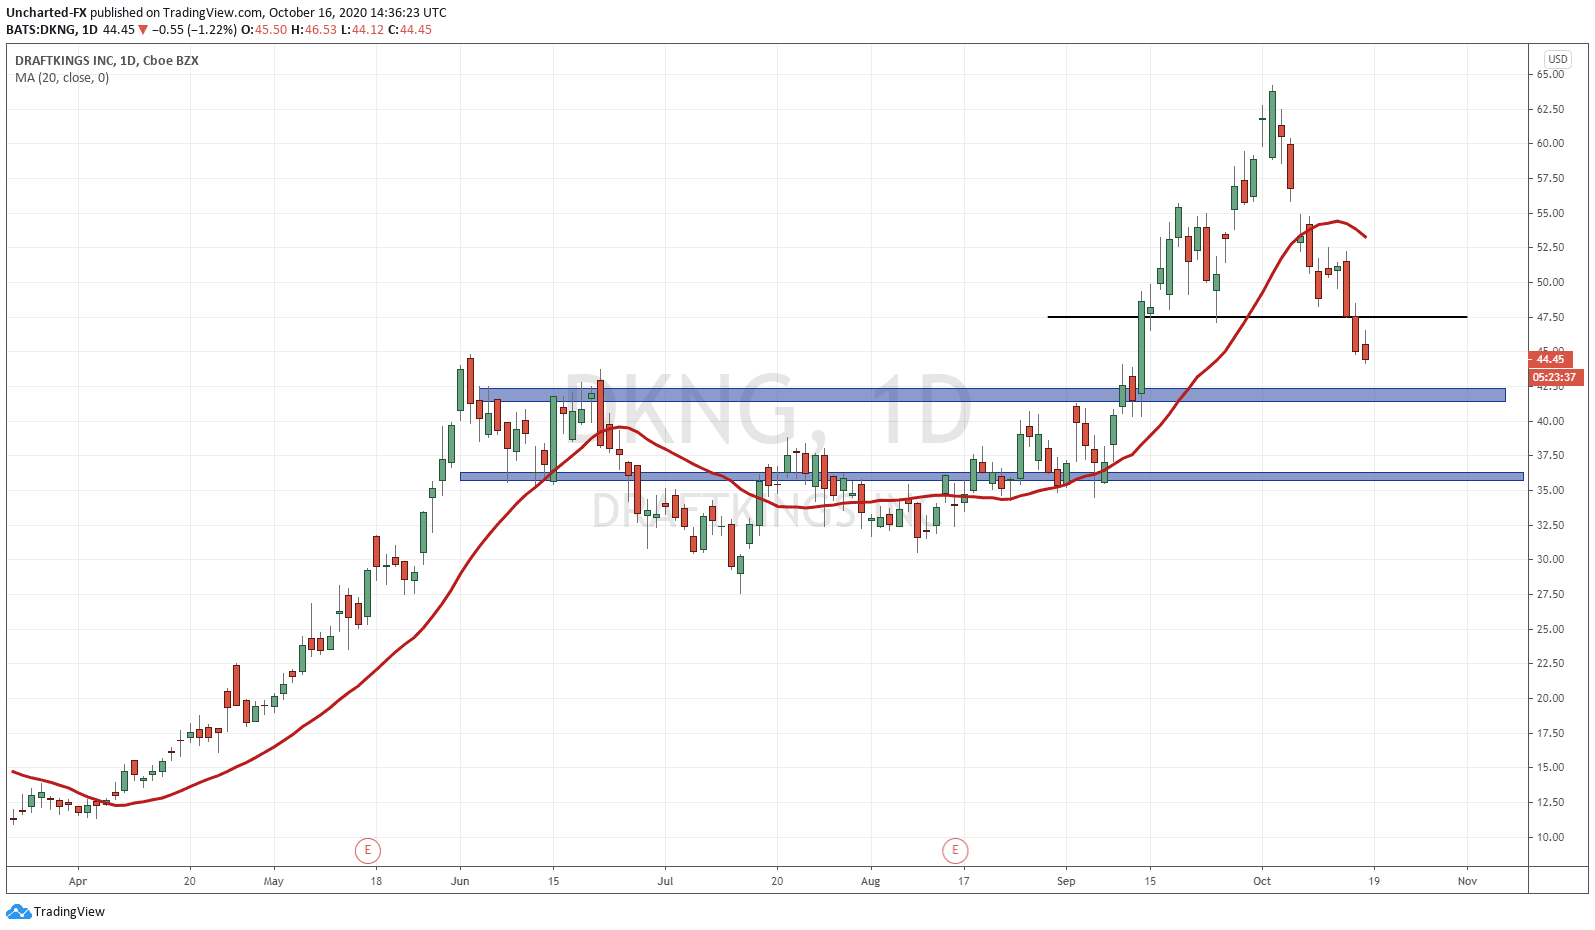
As you can see, the head and shoulders is quite clear and obvious on the daily chart. The trigger of the pattern is a candle close below the neckline. This was accomplished yesterday. I am expecting price to continue this downtrend as long as we remain below the $47.50 zone, now defined as resistance (price ceiling). As with all breakouts, there is a possibility we do reverse to retest $47.50 before reversing and continuing lower.
My first target would be the support (price floor) at the $42.00 zone. You can see it was previous highs, which took three attempts to breakout of. This is a very important zone, and where many will be looking to take profits. Also note, when we did breakout of this zone, price continued higher and has not retraced to retest the breakout.
As a trader, I would already set my take profit at $42.10-20. A little higher just because you know there will be tons of buy orders to close out as we get closer to support. However, alternatively, once can target the second support at the $36.00 zone. This would increase your risk vs reward, and you would obviously be holding for longer and accept the market risks such as a stimulus bill being passed etc. If you do this, it is best to see how price reacts at our first support zone at $42.00. If we see a strong indication of buyers stepping in, such as an engulfing candle or a large wick candle, it would be a sign that buyers will be defending this zone, and those who missed the breakout of this zone initially back in September, are now piling in.