Trevali Mining (TV.TO) has been a mining chart I have kept my eyes on, and notified the members of our Discord Trading Channel about a potential bottoming. At the time, Trevali was not moving as much as other miners. We discussed the opportunity to find lagging stocks, as we do believe a mania in metals and mining stocks is approaching which will be akin to the alt coins moving during the Bitcoin mania.
The key for an entry though is we need some signs of a reversal pattern. This has been achieved and confirmed.
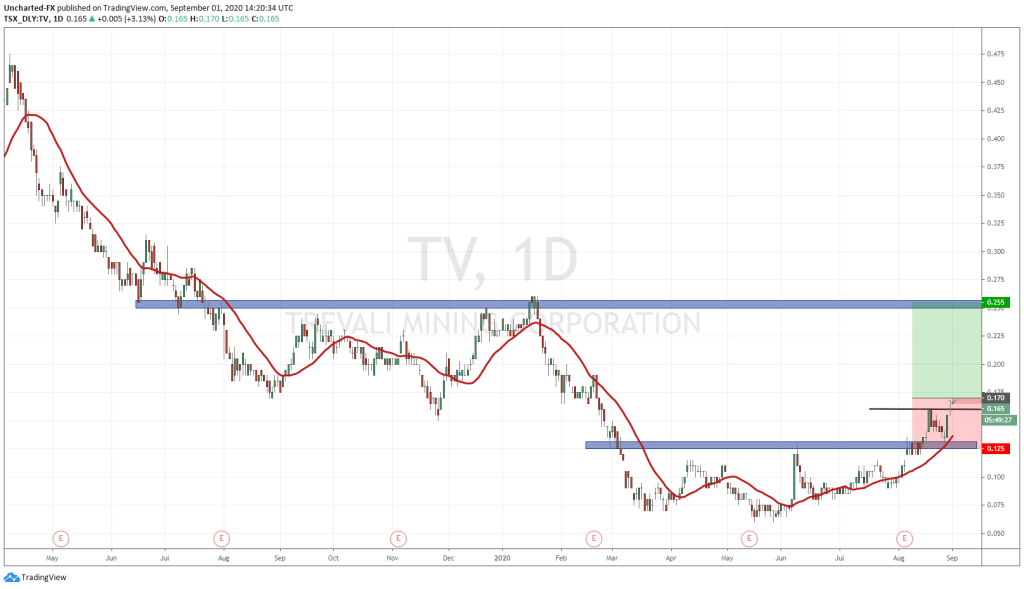
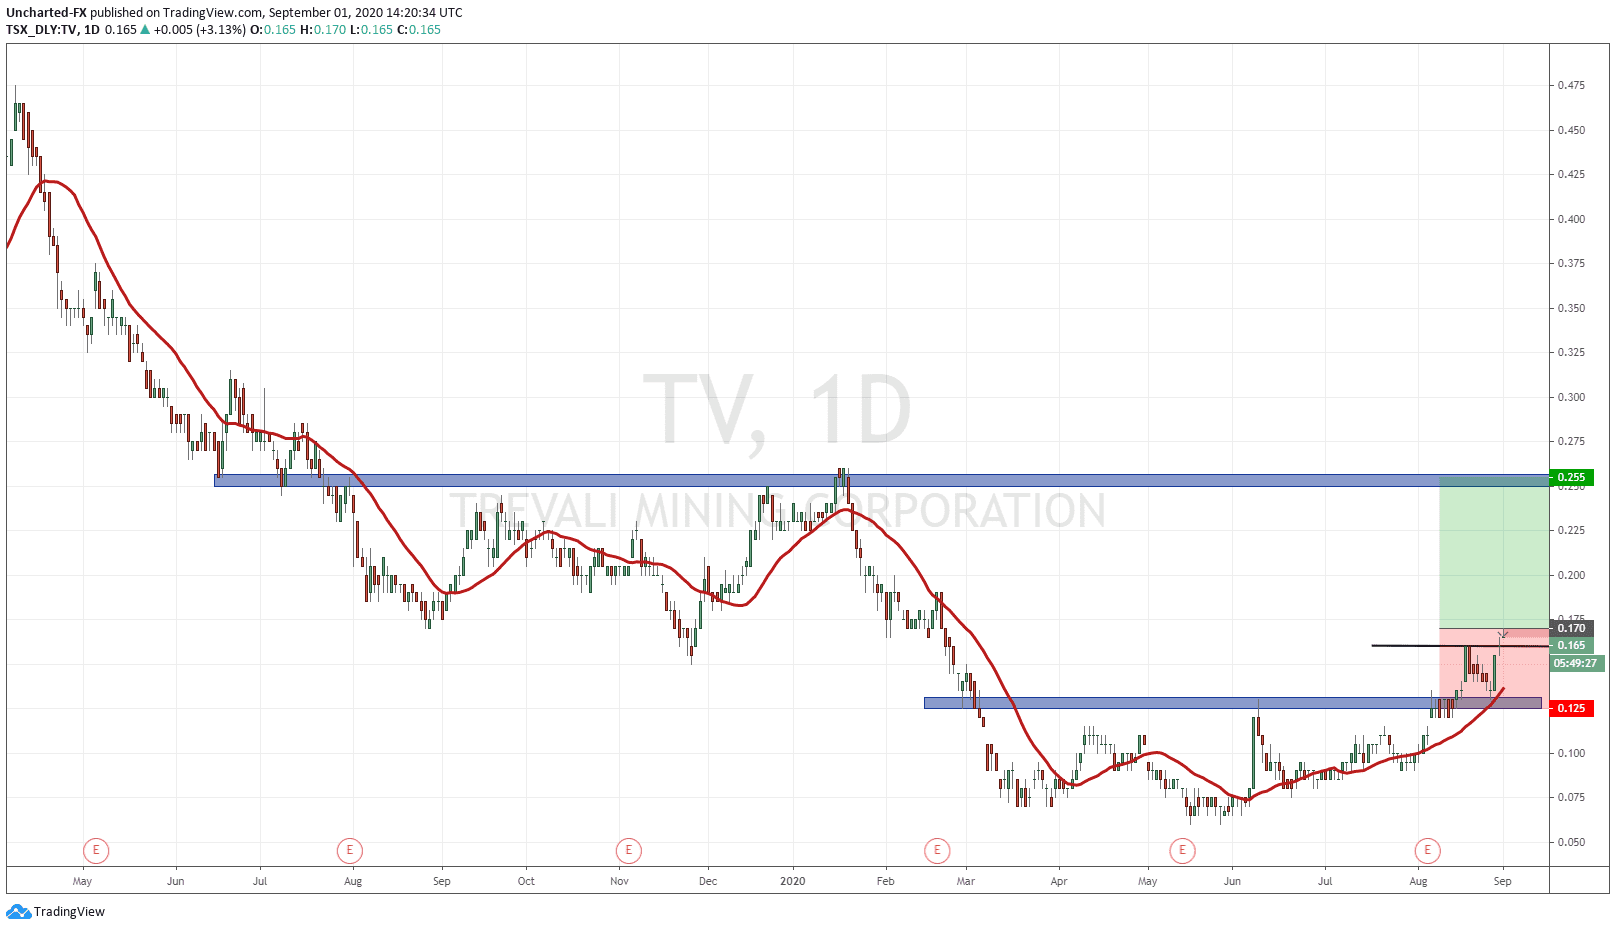
Firstly, the chart has been in a prolonged downtrend, but we could see the trend was exhausting as no new lower lows were being created. What happened instead? We created an inverse head and shoulders pattern giving us our first higher low to work with. 0.125 was the neckline we were working with as resistance. Well, that zone broke, which was the trigger of the inverse head and shoulders breakout. Price moved up for two days before pulling back to retest the breakout zone. Once again, this pullback is entirely normal, and is what I prefer to see.
As you can see from the chart, the buyers did in fact step in when price retested 0.125. And I mean strongly. We formed an engulfing candle, a candle with a large full green body which indicates the strength of the buyers. This is a very powerful candle especially when it appears at breakouts/breakdowns and on retests of previous support/resistance.
There was an opportunity to buy when price did retest the 0.125 zone. However, another opportunity would be to enter today. Price has broken above previous highs as you can see from the black line I drew. What this means, is that the retest of 0.125 has been confirmed, because it really is the higher higher that tells you the momentum will continue. Technically, it would be safer to await the daily candle close today, and await tomorrow. But I do like the strong engulfing candle as mentioned before, so yes, there is some more risk for not awaiting the close, but the confluence with the engulfing candle is hard to ignore.
The trade is valid as long as we remain above the 0.125 zone. I have placed my stop loss below this. In terms of upside targets, I like to target flip zones… or a zone which has been BOTH resistance and support in the past. That would come at the 0.24-0.25 zone. The risk vs reward is at 1.89 which is not what I really like. The stop loss or take profit can be slightly adjusted to obtain 1:2 risk vs reward.
So the technicals look good, what about the fundamentals?
Trevali is primarily a zinc play, and the stock is moving due to the rise in base metals. From their home page:
Recently, Trevali announced a management change:
Brendan Creaney, currently the Vice President of Investor Relations, has been appointed Interim Chief Financial Officer. Trevali has engaged a search firm and the process to retain a permanent Chief Financial Officer is progressing.
In fact, this came out on August 28th…the day we retested the breakout zone at 0.125 and created the engulfing candle on the market close.
On the 25th of August, Trevali announced positive results on their pre-feasibility study at Pinah mine in Namibia. Some highlights include:
-
Post-Expansion Production and Costs (2023 onwards)
- Average annual zinc payable production of 132 Mlbs;
- Average annual AISC1 of $0.64/lb; and
- Average annual lead and silver payable production of 21.8 Mlbs and 286 koz, respectively.
-
Proven and Probable Mineral Reserves: 11.23 Mt of ore (see table 5 for details), containing
- 1,550 Mlbs of zinc;
- 329 Mlbs of lead; and
- 6,892 koz’s of silver.
-
Project Capital Cost: $93 million, including:
- Modifications to the existing process plant to include a single stage SAG mill, crushing and ore blending system with a nominal throughput of 1.3 Mtpa;
- Paste fill plant and reticulation system;
- Dedicated portal and surface material handling and ventilation systems for the WF3 deposit; and
- Mine underground infrastructure.
-
Construction Schedule
- Expected to commence in Q1 2022; and
- “Commercial Production” expected in H1 2023.
-
Project Economics (after-tax)
-
Assumed metal prices: $1.11/lb zinc, $0.93/lb lead and $19.81/oz silver;
-
Net Present Value (“NPV”) at 8%: $142 million;
-
Free cash flow: $238 million;
-
IRR: 65%; and
-
Payback: <4 years.
-
Finally, Q2 results were announced on the 6th of August, including a resissue of 2020 guidance with lower all in sustaining costs:
- COVID-19 had a negative effect on the zinc price and financial results in Q2 2020.
- Perkoa, Rosh Pinah and Santander are all currently producing at full capacity with comprehensive COVID-19 prevention measures in place.
- Accelerated T90 business improvement program targeting the overall reduction in AISC1 to $0.90/lb by 2021, a year earlier than originally planned. Of the original target of $50 million in annualized sustainable efficiencies, the program is forecasting to deliver $43 million of recurring, annualized efficiencies in 2020, of which $30 million has been delivered at the end of Q2 2020.
- Undertook immediate one-time cost reductions to achieve an additional $37 million of savings in 2020 across sustaining and expansionary capital, exploration and operating expenditures.
- Secured up to $45 million additional liquidity under existing credit facility and a new facility from Glencore as well as covenant relief until December 31, 2020. Revolving credit facility availability increased by $10.0 million; minimum liquidity covenant of $15.0 million eliminated; new facility from Glencore of up to $20.0 million.
- Issued updated guidance for 2020 with production guidance for H2 2020 between 148 – 163 million pounds of payable zinc, C1 Cash Costs1 of $0.80 – $0.88/lb and AISC1 of $0.89 – $0.97/lb.
- Zinc payable production of 66 million pounds at a C1 Cash Cost1 of $0.93/lb and AISC1 of $1.05/lb. C1 Cash Cost1 and AISC1 improved from Q1 2020 despite lower production volumes as a result of cost savings implemented under the T90 business improvement program, by-product credits, and Caribou being placed on care and maintenance.
-
Adjusted EBITDA1 of ($5.7) million for Q2 2020 due to a decline in the zinc price (quarterly average of $0.89/lb) and reduced sales volumes of 72 million pounds of payable zinc due to lower production as a result of Caribou being placed on care and maintenance, COVID-19 related disruptions to production at Santander as well as lower zinc grades at Perkoa and Rosh Pinah.


