Trade ideas and market discussion can be found on our Public Discord Channel: https://discord.gg/akcgCVP
Check out and subscribe to our Youtube channel where charts and market events are discussed on our Morning Market Moment show: https://www.youtube.com/channel/UCG7ZYDUeNANJiDxH88F9aQA
he agricultural CFDs are not something I trade too often, but when a pattern and trade setup appear, I make it one of my priority trades. They tend to move very quickly which means a nice return in a few days, allowing me to redeploy my capital to other swing trades. The charts for Wheat and Corn are also setting up with a pattern, which I will discuss next week if they trigger (or you can join the Discord Channel where you will be notified of the break), but today I want to talk about Soybeans.
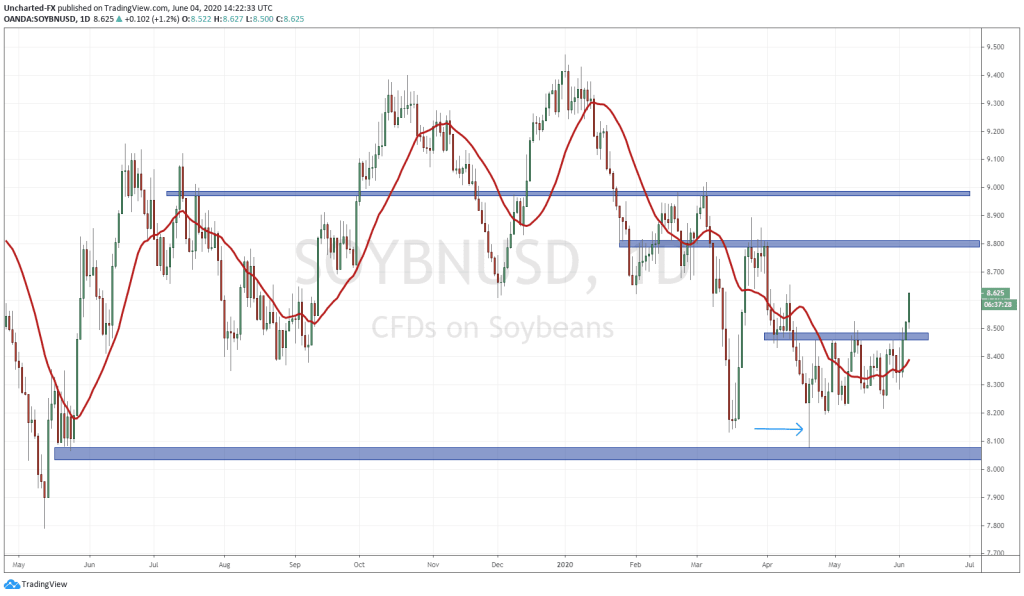
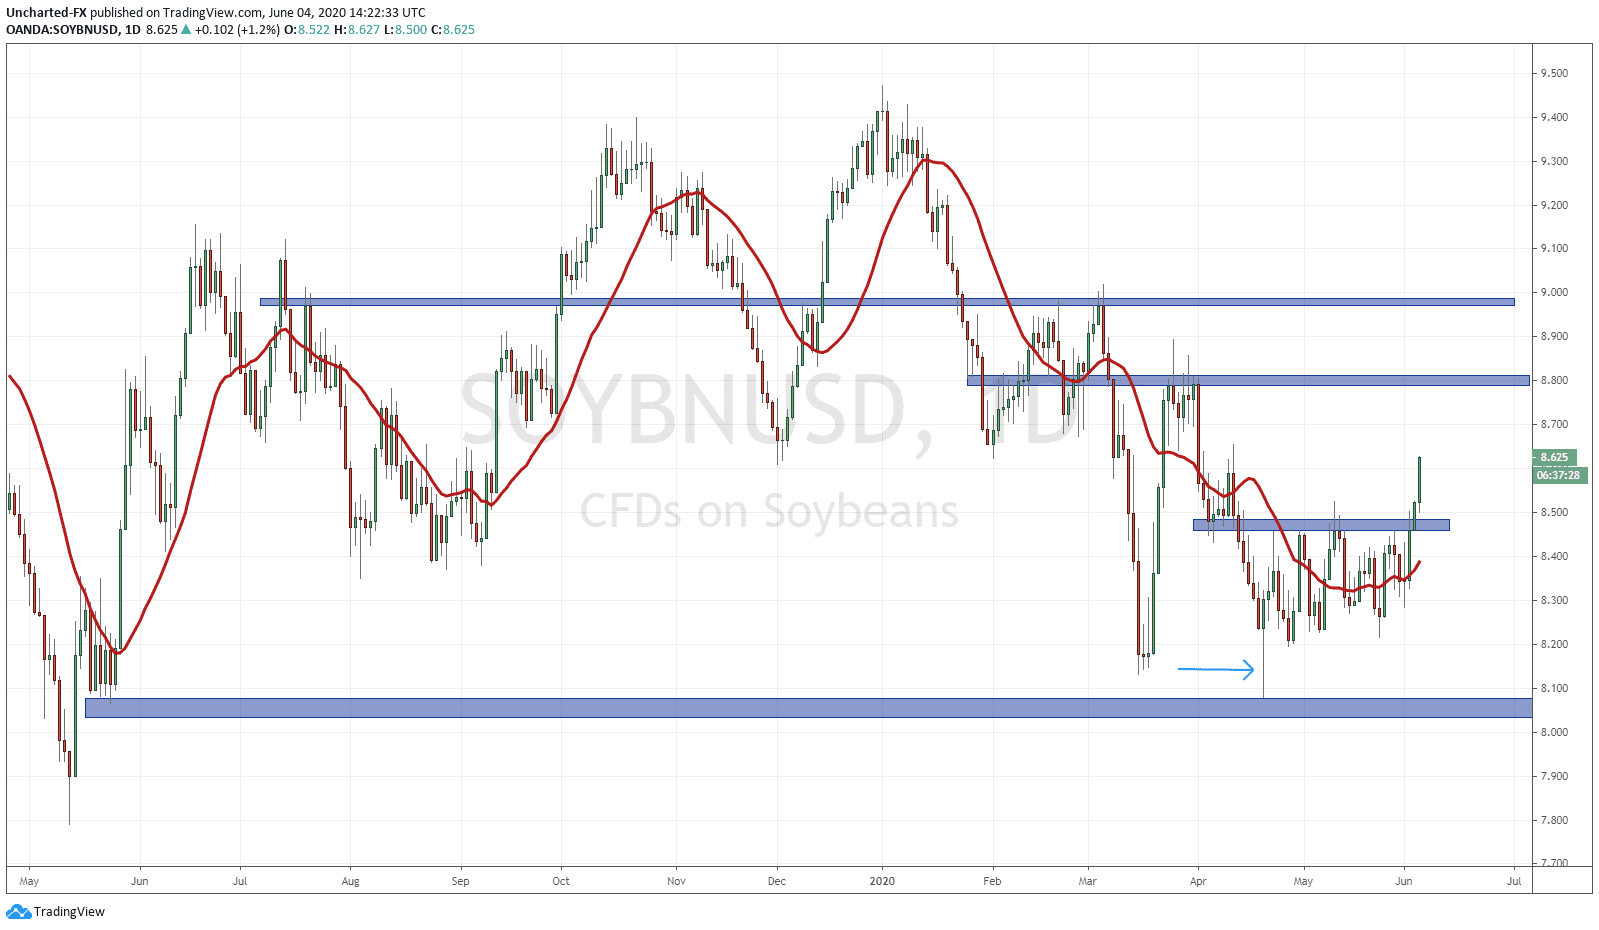
Let us start off with the technicals, and then we can explore the fundamental reason. As my readers know, all markets move in three ways: uptrend, range, and a downtrend. Our job is to know the foundations of these trends, and when they are likely exhausting. What comes next must be a range, or the opposite trend. Just how markets move. Looking at the chart of Soybeans (featured image above), you can see on the daily chart that we did indeed have a nice downtrend from 9.40 down to 8.10 (remember this is a CFD chart). At the 8.10 support zone, which was major as you can see my looking to the left of the chart, the downtrend began to show signs of exhaustion. We know this because no new lower lows and lower highs were being made. In fact, look at the large wick at 8.10. This is what is called a fake out pattern, and why we wait for candles to close before entering a trade. Some traders who jumped the gun, thinking Soybeans was about to break down, got trapped. We do not fall for traps.
As mentioned, price stopped making new lower highs and lower lows, and thus began to range. The price action of the chart shows a nice rolling over upwards of the chart, and some can say this was a bottoming pattern such as a double bottom or a head and shoulders. All these patterns indicate to us is that the trend is reversing. My trigger is usually a resistance zone for the breakout play. I have my zone at 8.50, which is also a flip zone (area that was both support and resistance). Yesterday, we got the breakout and Discord members were notified. So far the continuation and momentum has been great! The trade is progressing well.
In terms of targets, I would say 8.80 and then 9.00. Price can very well pullback to make a higher low swing before reaching these targets. I would be a bit careful here as 8.60 is the previous lower high and has not been taken out yet. As long as we remain below the lower high, we are technically still in a downtrend. However, the trend exhaustion we have seen indicates the weakness in the downtrend.
So in terms of fundamentals. This is my US China trade deal play. When the phase 1 trade deal was announced, the details were iffy. What we knew was that China was going to increase their American imports by buying agriculture, mainly Soybeans. To be honest, this is not a great achievement. The Chinese can very easily renege on the deal and purchase Soy from Brazil, or even Canada. In fact, on my personal social media page I spoke about the Chinese reneging a week after the phase 1 deal was implemented! They continue to renege on the deal!
Reports came out earlier this week on China halting the imports of US agriculture. If these reports are confirmed, it would mean the phase 1 trade deal is precariously on the edge. Perhaps the charts are pricing this in. I am one that does not believe in perfect information in markets. People with knowledge on events beforehand do take positions. Price action provides a handy tool to be able to predict what may be coming down the pipeline. I have used it to predict economic data for forex pairs (ie: will employment numbers come out better or worse than expected). Even when earnings are going to come out, generally prices act in a specific way that can indicate what the earnings will be. Just something I have noticed in my now 8 years of following the markets and trading. I must stress I use this in conjunction with market structure! If we are bottoming, or are in a prolonged trend then the prediction is more relevant.
Many traders look for news to come out which then causes the price to move. I see it the other way around. Generally market structure plays out, and then the news comes out a few days or weeks later which provides the reason. Looking back at Soybeans, perhaps we are seeing the pricing in of the Chinese officially saying they will halt US agriculture purchases as a way to retaliate to US condemnation. Time will tell, but as of now, I like the market structure of Soybeans and the other agriculture charts are setting up too.


