Trade ideas and market discussion can be found on our Public Discord Channel: https://discord.gg/akcgCVP
The S&P 500 just today gave us the breakout we have been looking for over at the discord chat and which I posted about in yesterday’s blog. We are awaiting now for the Nasdaq to break out, currently testing an important resistance zone, and the Dow to join the break out party. Other indices that are breaking out are the Nikkei 225, the UK FTSE 100, the Hang Seng, the German DAX and the French CAC 40. Big technical patterns being triggered here.
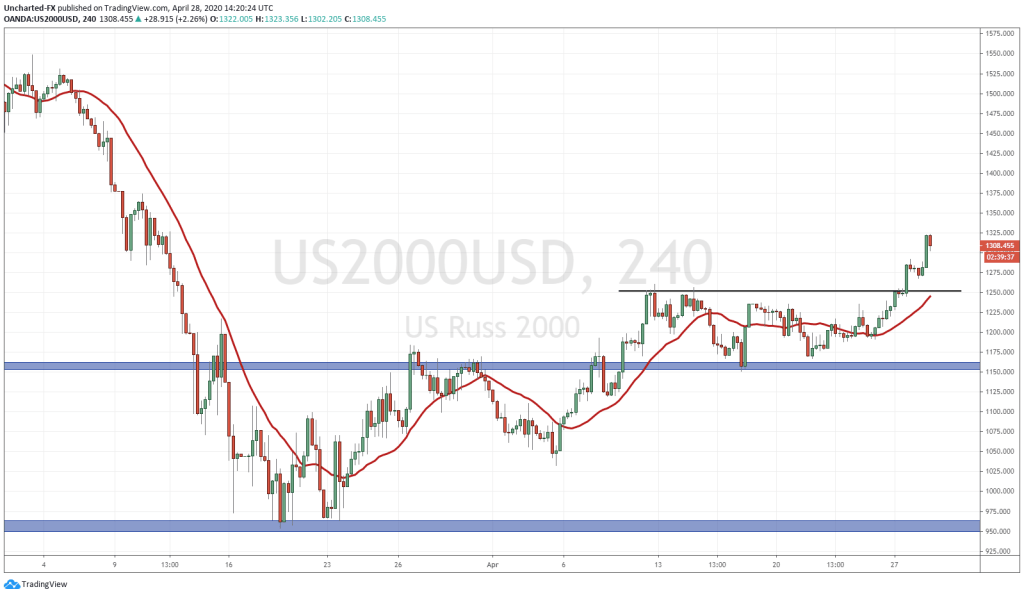
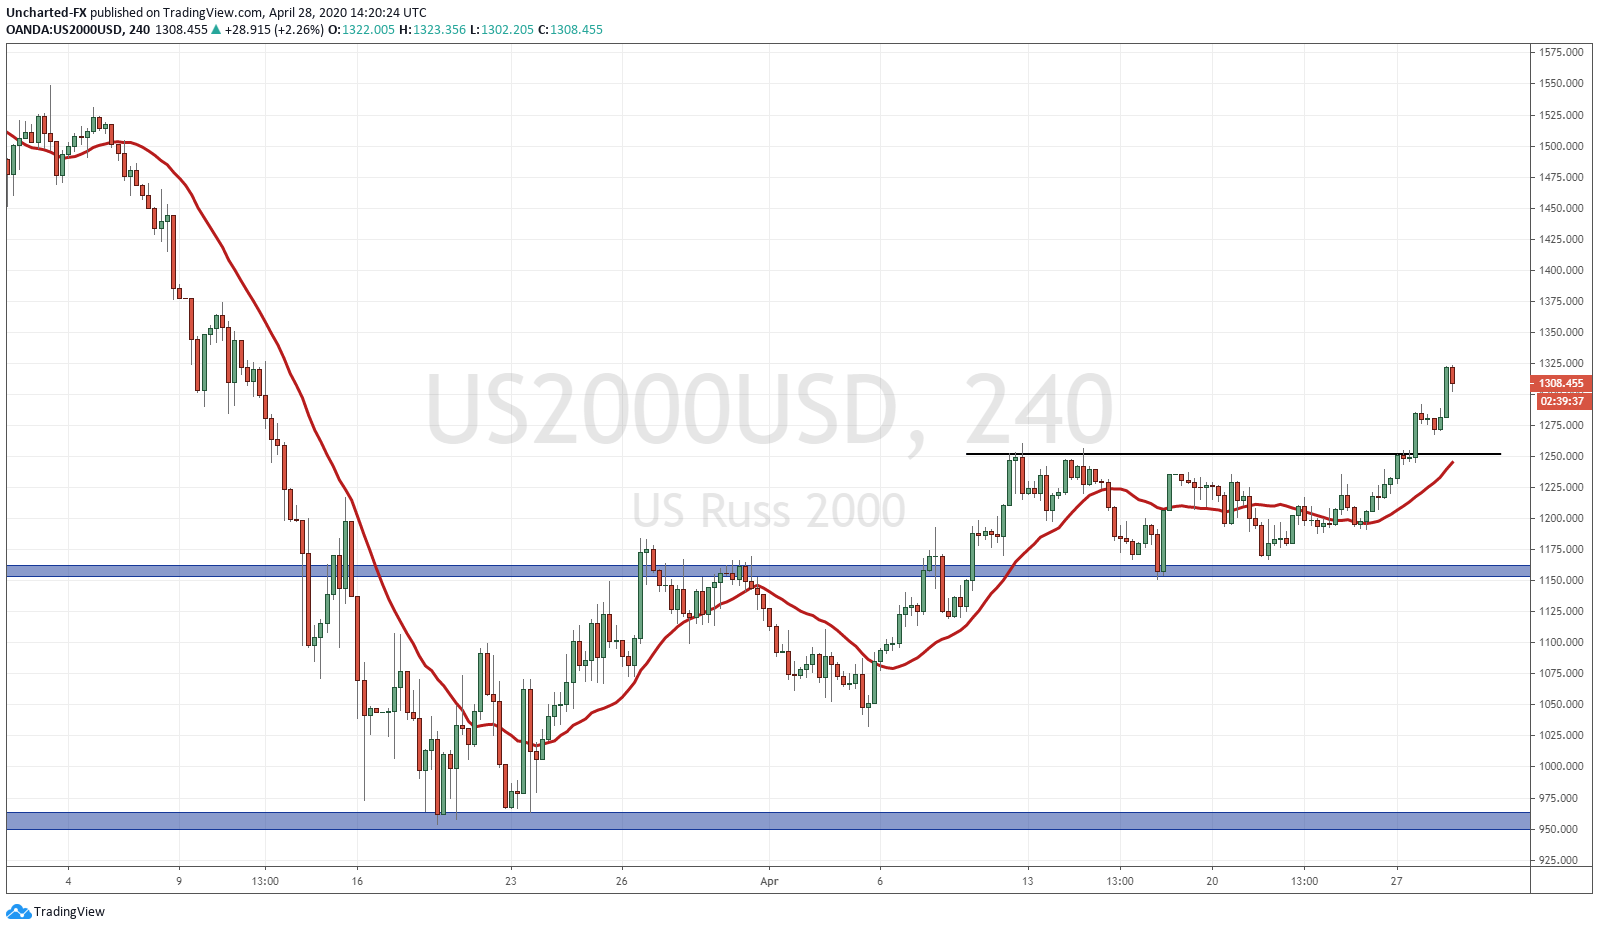
The one index I have been watching very closely is the US mid cap index, the Russell 2000. In fact, over at discord, we coined the term RTR, or Ride the Russell – playing on Ride the Lightning by Metallica. It is a chart I personally have been keeping tabs on ever since we had that cup and handle breakout pattern confirmed on the daily chart. It was covered in an Equity Guru Market Moment blog post. It was a trade that I took, and ever since that break out, we just ranged, as you can see on the 4 hour chart clearly. This coincided with the other market ranges we had on other indices and were awaiting for the break in either direction. In the case of the Russell, the first break out had already happened, and when this occurs, we follow the principles of market structure.
The fact is that markets move upwards (or downwards) on swings. These swings are called higher lows in an uptrend, and are what constitutes an uptrend. As long as price remains above this swing, we are in an uptrend. When price breaks below, the trend is now over and we either range or begin the opposite trend (in this case, a down trend).
In the case of the Russell, the first swing we worked with was 1142. As long as price remained above here, further moves higher were expected. What did we do? We ranged here but held above 1142. Now we have our second higher low swing with this break out which occurred yesterday. 1242 is the next higher low swing zone that I would be keeping tabs on. It also was a very strong breakout as seen by the size of the candles body. Price reversing and closing below the break out candle would tell us the break failed to build momentum.
So the chart looks good for the Russell 2000. Any fundamental news to aid us? Well, yes. Two in fact. First of all, we do have the Federal Reserve Interest Rate Decision tomorrow. The Fed is expected to keep rates unchanged (although already talks of negative rates), but what traders really want to hear is how much. How much more money will the Fed keep printing and keep throwing to keep things propped. The Fed has been backstopping the markets, something Jeffrey Gundlach spoke about on CNBC yesterday. This rise in markets has been the Fed and the fact that they have created an environment where there is nowhere to go for yield. The Fed is not likely to end their easing any time soon, which will be stock market positive.
The second confluence is the economy reopening story. As of now, European nations are in the process of reopening their economies along with US states with discretion from their Governors. The first few weeks could have some potential euphoria. It will mainly come from restaurants and public places being reopened. People will be going out to spend money and get out of the house. The mainstream media and financial media will be calling this the V shaped recovery in the economy. It will be stock market positive. All indices will gain, but I think the Russell will move more. There will be talks of small and medium sized businesses reopening, and the media will focus their attention on that. They’ll talk about how the government wage and small business programs worked, and that this turned out to be a great response. There will be no talk of the debt incurred and how to pay for it. This euphoria, however long it may last, is what will get the mid cap index to move higher. This is in play for the next few weeks to a month.


