Trade ideas and market discussion can be found on our Public Discord Channel: https://discord.gg/akcgCVP
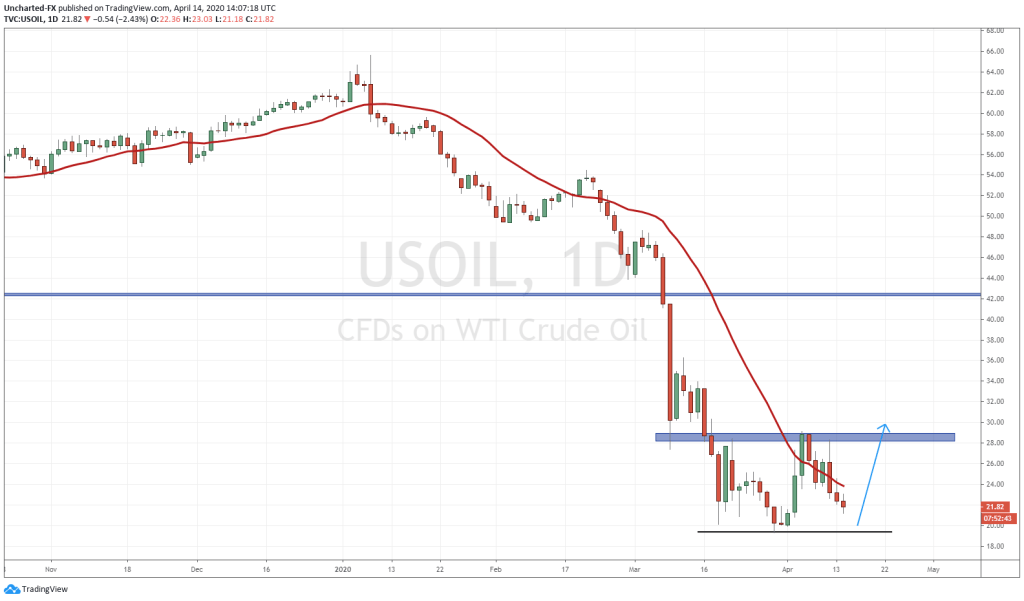
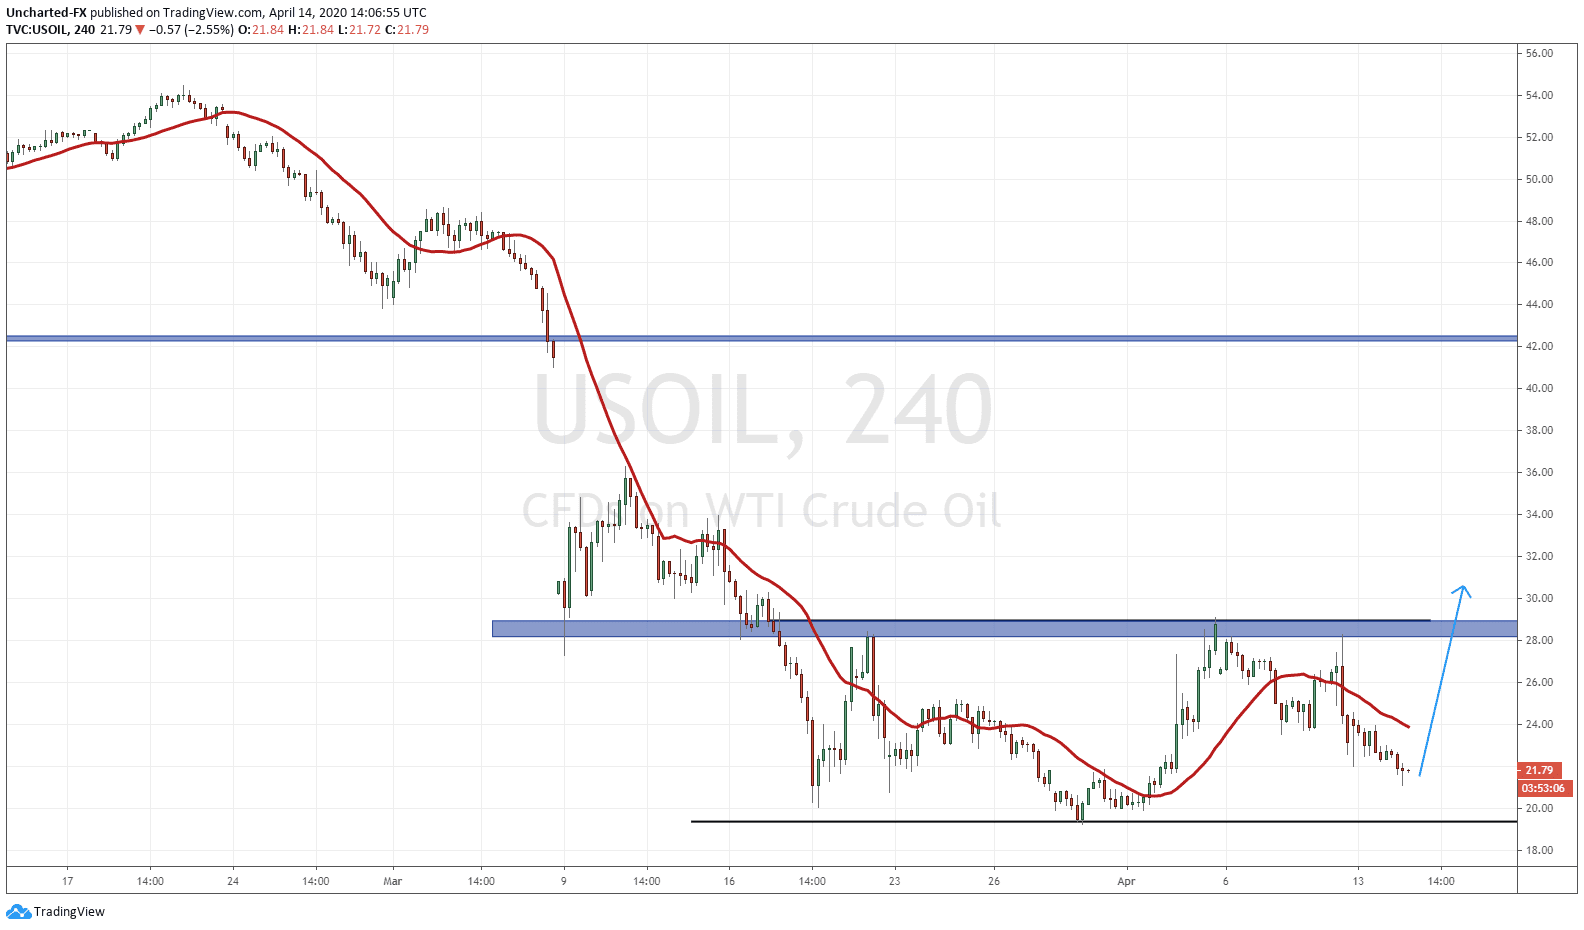
We have been covering oil many times these past few weeks. Our double bottom set up from last week provided us with over a 20% gain in a few hours if you did close positions at the resistance zone. On the 4 hour chart, we have been talking about a potential head and shoulders pattern. Price creating our first higher low in a new uptrend but requires a break and close above 29.00 to trigger this. So far, we have been drifting below but if we were to create a right shoulder, it would happen here.
On the daily chart, there is another option. Yes, if we break and close below the 19.50 zone, we would make another wave lower. However, it seems the trend here could possibly be exhausting. Is it possible to see buyers step in here or close to here, and put their stop losses just below? Or is it possible we may create a double bottom pattern (creating a “W” shape showing us a reversal)?
OPEC did come out with a 9.7 million barrel a day production cut. The market did not react well to the news. Oil still sold off on the open this week. In fact, yesterday on twitter, it seemed President Trump tried to give oil a bit of a boost, saying the actual cut could turn into around 20 million barrels a day rather than 9.7. Market still did not buy it. If that were to be true, market participants would want to see it on paper.
The truth is that there is still a large supply glut. Demand is decreasing sharply, and Supply is not keeping up with that. A production cut would have to be substantially more, but of course that is difficult to do as the OPEC nations still rely on oil for government revenues. None of them really want to cut it. Oil being higher is one of the keys for a prolonged market rally. On the discord chat, we are watching the US 10 year yield to stabilize…indicating some money leaving bonds for stocks, and we are watching oil. Why oil? Because banks were forced to lend to oil in 2014, and now have significant exposure to energy. When oil moves up, it impacts both the energy and financial sectors on the market.
The news for oil got worse today as the IMF came out stating that this economic downturn due to the lock downs around the world will rival the great depression. 2020 will not be pretty, but 2021 will show a bounce. The numbers of growth can be seen here.
This of course means that if we are heading to a recession/depression, then demand for oil will continue lower. The production cuts will have to increase in order for supply to fall accordingly with demand. To be honest, I would keep an eye on the Middle East. I would not be surprised to see some sort of event there occur to spike oil. This 29 level is still key either way you look at oil: on the 4 hour chart and the daily chart.


