Trade ideas and discussion can be found on our Public Discord Channel: https://discord.gg/akcgCVP
As we begin this morning, we have received an amazing pledge by the US Federal Reserve. They have pledged unlimited asset purchases to support markets. This is from the monetary side, what is next will come from the fiscal side. Traders are awaiting for the US Congress to pass the relief program, a bill that was turned down yesterday before markets opened, prompting a sell off and market futures to halt (limit down) just as futures opened. Once we get the combination of both the monetary and the fiscal side, we should expect to see some sort of basing in markets.
But we are not out of the woods yet. What this entails is money printing on a scale never seen. Last week, the Fed promised to keep liquidity going, and short term interest rates suppressed by announcing a 1 Trillion Dollar a day repo for the next 30 days. Hard to believe this repo program began last year in Fall at 35 Billion a day, with the amounts increasing gradually to when the Fed announced earlier this year that they would look to end this repo program come April. That will not be the case now, in fact there is a good probability that this 1 Trillion amount could increase or would last more than 30 days (become indefinite).
I want to take a look here at Silver for this week. Silver took a beating as many retail traders ran for cash, and closed their speculative positions to avoid margin calls. However, many would say Silver fell because it is an industrial commodity rather than one with a monetary aspect, and traders are pricing in a recession, just as they are with Copper.
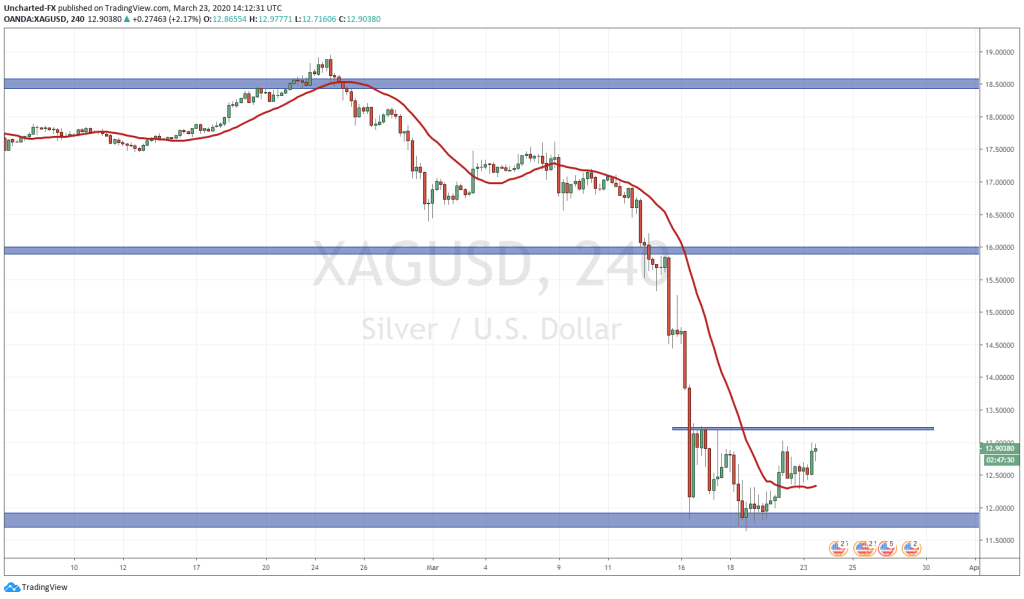
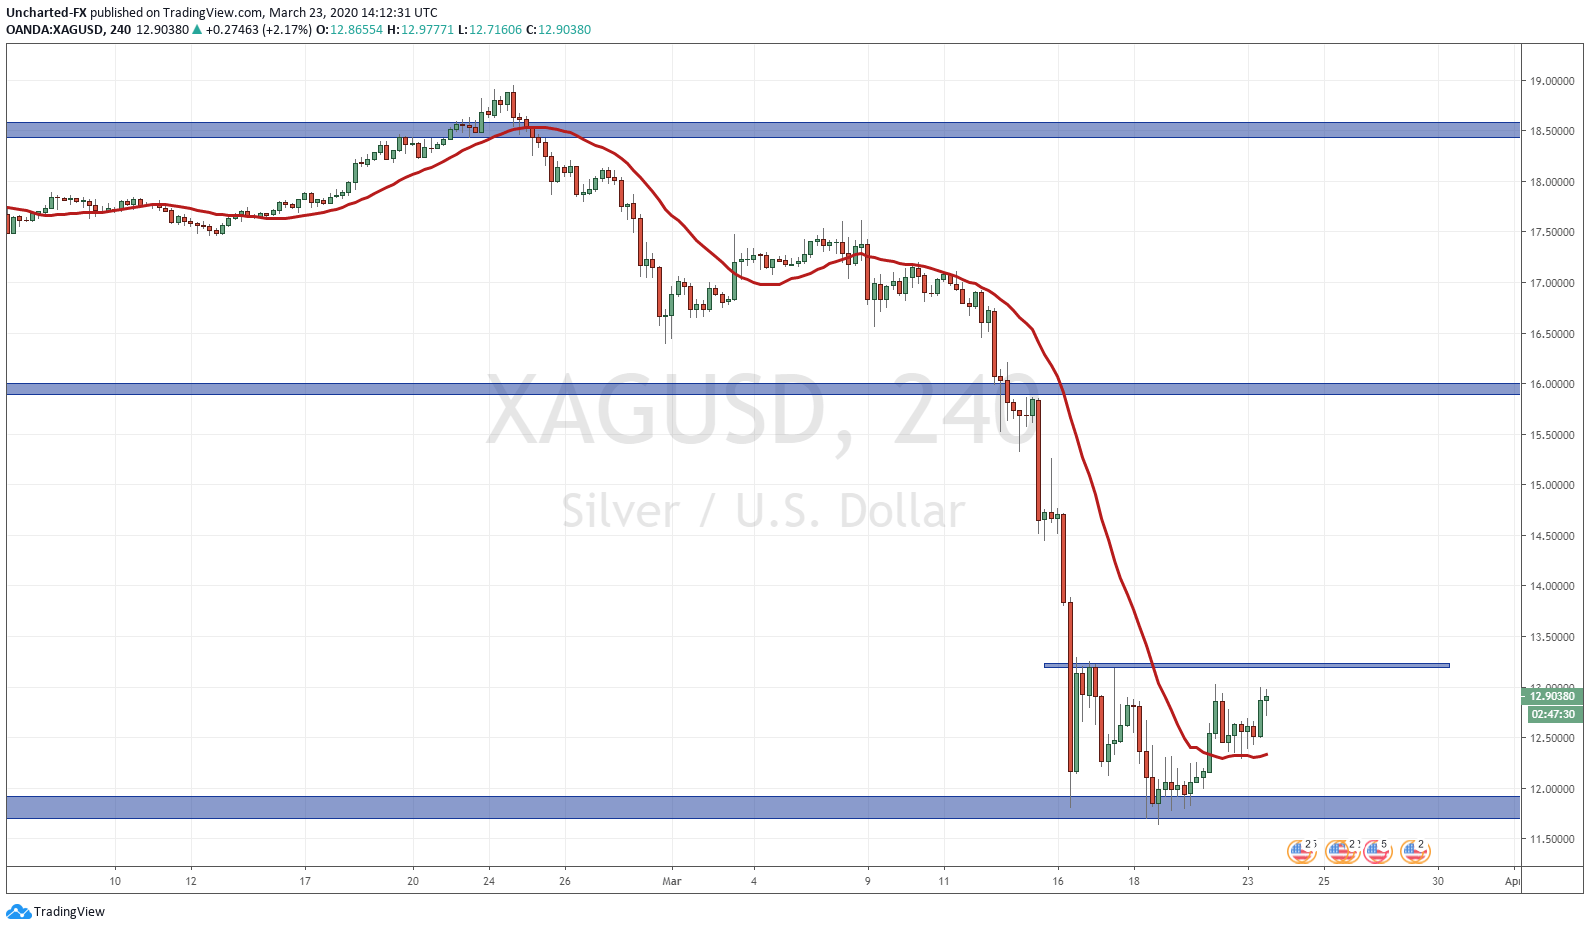
The chart here on Silver is looking promising. We hit a large support zone at the 11.70 zone, and from here we have seen buyers begin to step in. Many Silver miners are not making money at these prices, which means higher prices should be expected as supply would be removed. What we are seeing right now is a potential bottoming and/or reversal pattern. A potential shift from a downtrend to an uptrend. The downtrend here has been very long, and we have multiple lower high swings (pullbacks in price before resuming downwards). This pattern here, called the head and shoulders pattern, is showing us the possible exhaustion of this downtrend. Nothing is confirmed until we make the break and close above the 13.25 zone here. This is a chart that we will be monitoring on the discord channel this week and beyond if necessary.


