
You have probably heard the words “Bitcoin” and “death” used in the same sentences all over financial media and blogs. No, not from the super bears who hate Bitcoin, and have always been using those two words together. What I am referring to deals with the technicals. Technical analysis used on charts are indicating a situation known as the Death Cross. Others who tweak with the analysis call the situation the Kiss of Death.
So what the heck do these ominous sounding things mean?
A death cross is a term which is used to notify the crossing of two particular moving averages: the 50 and the 200. And it is a bearish pattern…you probably guessed that by the word ‘death’.
If you read general investing books, the 200 day moving average (MA) is mentioned a lot. Many say it is the best long term technical indicator to use because of its simplicity. If price is ABOVE the 200 MA, the asset is in an uptrend and you should buy. If price is BELOW the 200 MA, the asset is in a downtrend and you should sell. When price crosses above or below the 200 MA it is usually a big deal, and will garner a lot of action.
While the 200 MA is seen as a longer term investment indicator, the 50 MA is seen as the medium term swing trade moving average. Not a surprise that people chart both. Similar approach with the 50 MA: if price is above, you buy, and if below, you sell. The key though is the cross of the 50 and the 200.
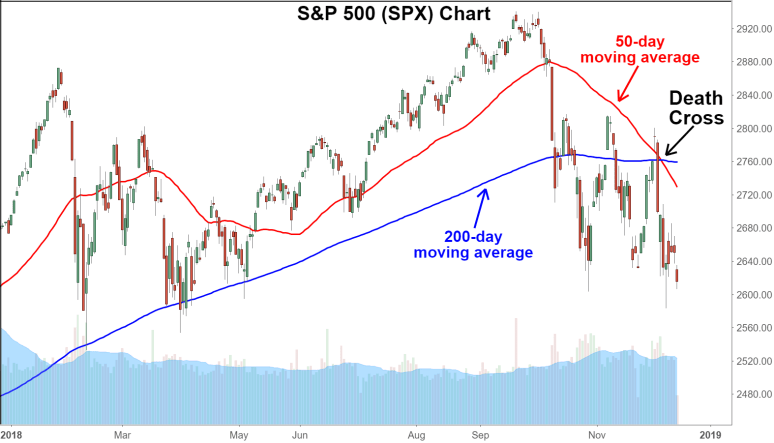
When the 50 MA begins to turn, and then subsequently crosses the 200 MA, you get what is referred to as a death cross. A very bearish indicator. The opposite of a death cross is the golden cross. In this pattern the 50 MA crosses ABOVE the 200 MA which is a very bullish signal.
Others who use the exponential moving average (EMA) rather than the moving average, are seeing the same thing. Their EMAs are crossing, and they call this the Kiss of Death. The point here is that many trader’s bearish triggers are going off.
Do these crosses work? In a way, they become a self fulfilling prophecy. The 200 MA is extensively used by financial media heads. You will see it referred to all the time on CNBC. Truth is that it is simple to use and understand, and it gives one some sense of control over markets. Maybe it even makes them sound like they know what they are talking about.
If the media is mentioning this death cross over and over, there will be traders who sell. I think this will be stronger today due to all the new money out there. A lot of people have picked up trading, and this is the first death cross they are a part of.
My readers, and those who follow us over on Equity Guru’s Free Discord Trading/Investing room, know that I have always said two legs lower are coming for Bitcoin. I was targeting $20,000. I don’t use the 50 nor the 200 day MAs. I use market structure.
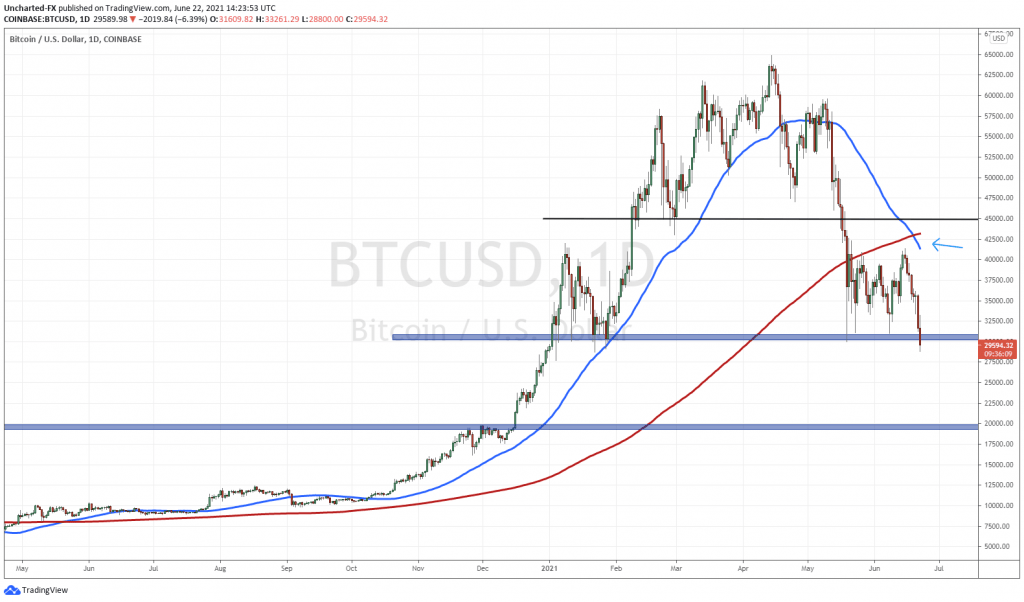
Let’s take a look at Bitcoin’s death cross:
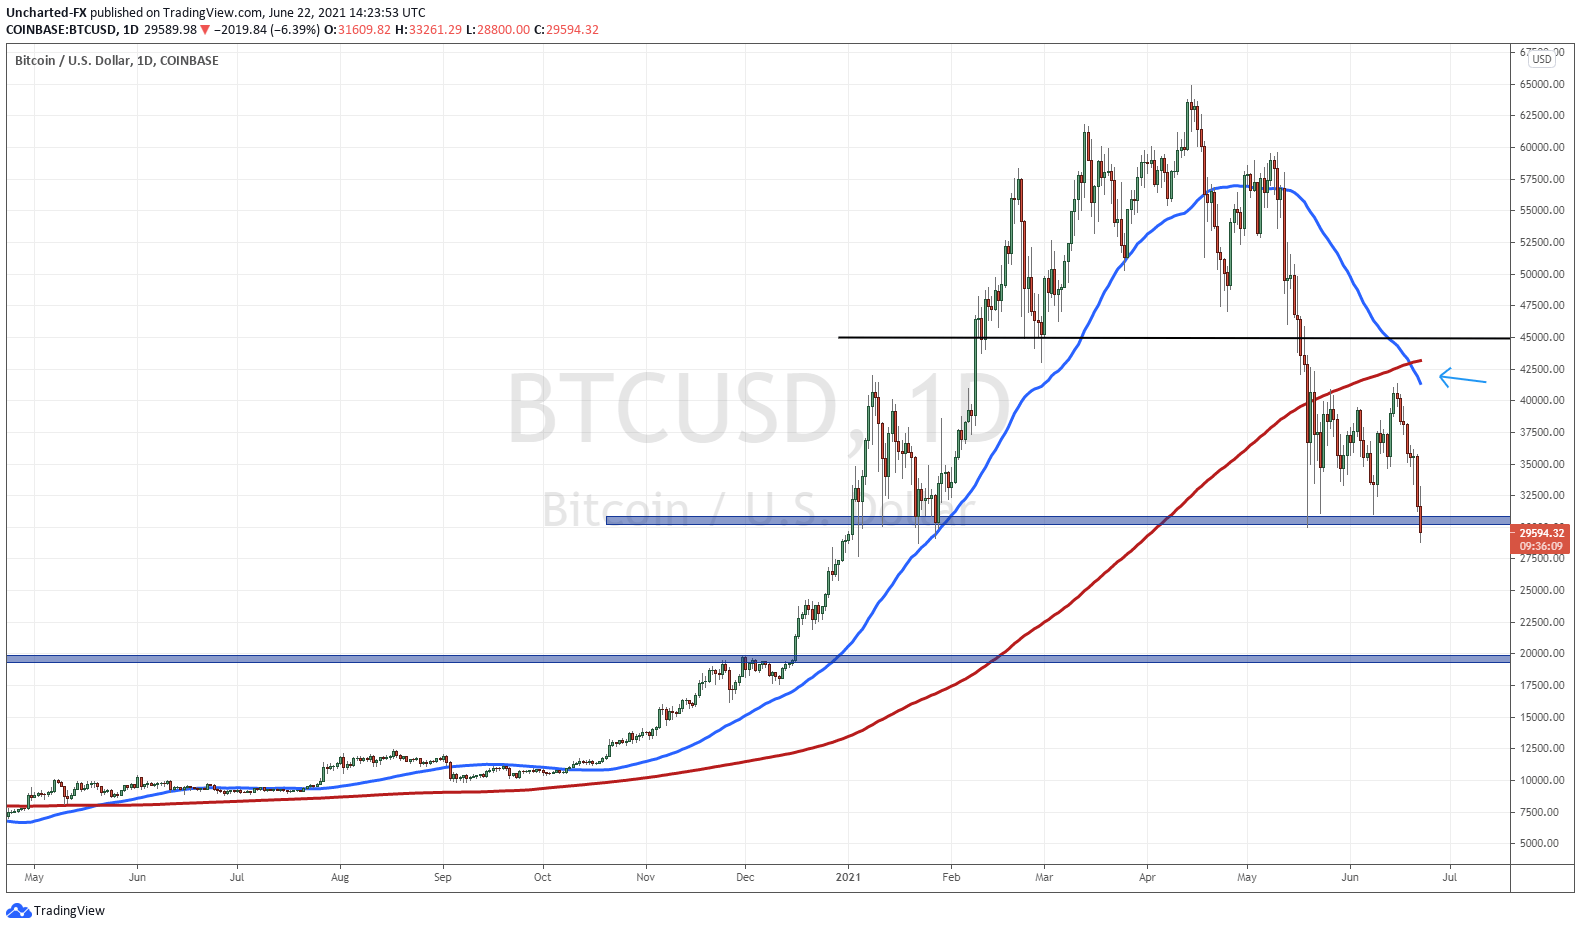
The blue line is the 50 MA, the red is the 200 MA. As you can see, the 50 MA began to curl around $55,000, and the cross just triggered a few days ago.
More importantly, Bitcoin is NOW breaking below the major support (price floor) at $30,000. A close below like this on the daily candle is very bearish. It sets up a move down to $20,000. Once Bitcoin broke below $45,000, we just fell. Remember: trends don’t move up or down in a straight line. They occur in waves. I call these swings. In a downtrend, we should expect price to pullback and then move lower. Just like we are seeing currently. The technical term is a lower high swing.
We just have our first lower high swing, and the worrying part of Bitcoin bulls, is that swings usually happen in pairs. Perhaps this swing prints on the way to $20,000. Meaning we move down to say $25,000 and then pullback up to $30,000 before selling down to $20,000. That would be a second lower high. If prices just flush down quickly to $20,000 then things become tricky. Depending on how the chart reacts, we actually could be looking at $15,000 or lower. But right now, $20,000 is the important zone.
If prices close above $30,000 today, or back above $30,000 on the retest, then we are safe. We will have a fake out.
What is behind this bearish sentiment? China. The CCP is coming down hard on Bitcoin miners. Ray Dalio in the past said that government’s could come down hard on Bitcoin, the question is do the Western nations follow? A digital currency is coming, so the chances are high they regulate Bitcoin and other crypto’s.
In other Bitcoin news, we don’t hear much from Elon Musk. The play is still cleaner and sustainable mining. If Tesla starts accepting Bitcoin for their vehicles once again, that could be a bullish catalyst.
But perhaps not. Yesterday. we heard that MicroStrategy (MU) now has 100,000 Bitcoin with a value of over $3 Billion. BTC still broke down. This is why I love market structure. All markets move in cycles, and unless some large black swan event comes out of left field, nothing can stop these cycles from completing. Bitcoin needs to complete its cycle, and until it does, we are in a bear market.