

Properly digesting a public company’s financial statement is a must before making any investment decision. For those of us on the outside, it’s as close as we’ll ever get to knowing how a company operates.
Quarterly-filed reports denote the company’s earnings, losses, expenditures and more within a three, six and nine-month period.
These reports are not easily digestible. Although the numbers will (generally) be correct, by omissions or accounting sleight-of-hand, a corporation may present its achievements in a distorted or flattering light. Always read the notes at the bottom for the “methods” used to produce line items.
Nobody can become an expert in international financial reporting standards overnight, but with a few tricks anybody can increase the likelihood of making an intelligent investment.
Take Nike (NKE.NYSE) for example. The shoe and apparel manufacturing giant is worth $103B and publishes a simple six-page financial statement on their site (the actual filing is over 100 pages long).
What it does and how is easy enough to understand: Nike makes clothing. When considering an investment in a smaller company, it’s equally important one understands the business model, if not more. Blue-chip stocks like Nike aren’t subject to volatile price action like a small-cap company is.
These sheets should be read with care, and revenue is important for understanding a company’s value as an investment, but that’s just the first step in the vetting process.
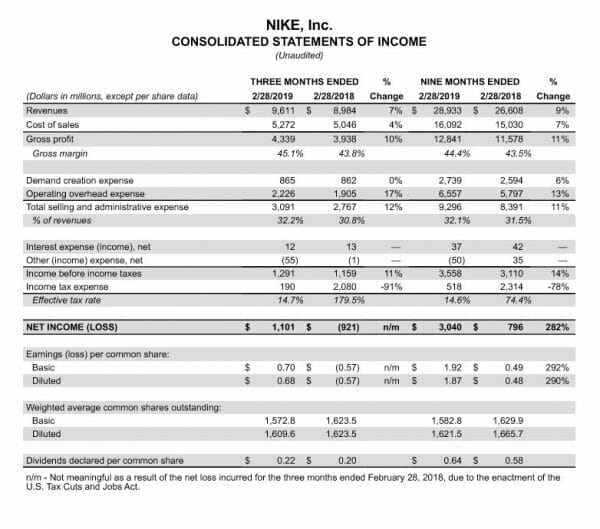
Nike’s revenue for Q1 2019 was $9.6B, a 7% increase from Q1 2018. When trying to gauge quarterly performance, it makes sense to examine identical quarters from previous years rather than two consecutive quarters for a number of reasons.
One-time events can throw-off results or make quarterly performances more impressive than they are under other circumstances. Although Nike sells more apparel during global sporting events like the Olympics, using sales numbers during world cup season as a baseline for profitability is inviting disappointment.
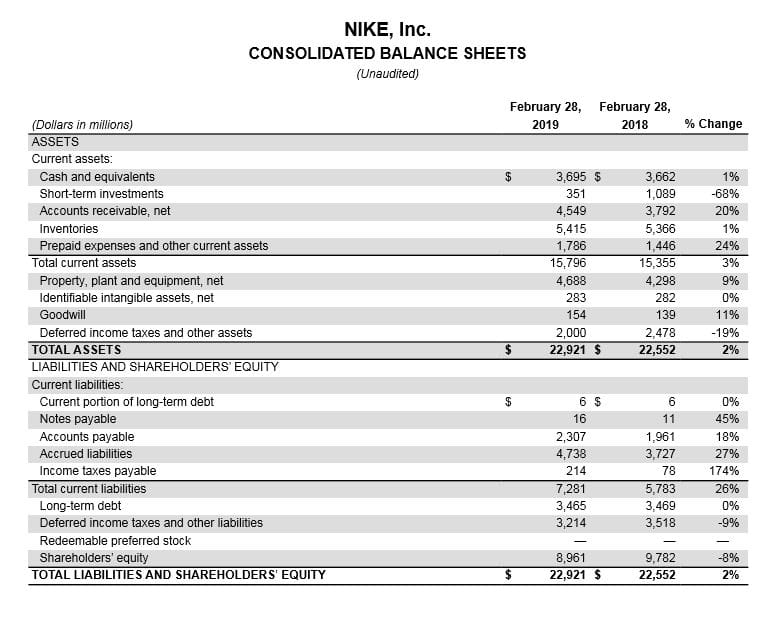
Let’s take a look at Nike’s quick ratio, the first tool in our assessment. Quick ratios determine liquidity and the speed at which a company can react to financial hardship.

Nike’s ratio is 2.5, above the ideal benchmark of 2. This means the company has more than enough liquid assets to cover its liabilities if necessary. In our pros and cons list, this is a plus.
To see the quick ratio at work in the cannabis sector, check out our coverage on Biome Grow’s (BIO.C) latest financials.
Now let’s assess fair market value (FMV). To do so, we need to compare Nike to its peers in the space. Namely, Under Armor (UA.NYSE), Adidas AG (ADS.XFRA) and perhaps Lululemon (LULU.Q).
These companies were trading at $22.60, $291.16 and $171.13 respectively compared to Nike at $82.55. On the surface, one might imagine share price (SP) is an indicator of a company’s value but in reality it just means there are more shares in circulation.
Determining FMV will take more analysis like the quick ratio mentioned earlier, but the share price is crucial in those metrics.
Let’s examine price to earnings (P/E). This figure is found by dividing SP by earnings per share and tells us if a stock is overvalued.
Nike’s earnings per share is USD$2.56 and therefore its P/E ratio is 32.3. This means investors are willing to pay $32 for every dollar Nike earns.
The S&P 500, a collection of the top 500 U.S. stocks on the market, has a historical P/E of 16.5 for comparison. Nike is overvalued, but not as much as Under Armor’s ratio of 65. Nike is a good stock but keep in mind that you’re buying a Ferrari at a premium.
Cash flow and debt are also considerations in any investment decision. Are revenues growing? Are they expected to continue growing? Nike’s Q1 2019 statements say revenue in China grew by 19% over the same quarter in 2018, but were still lower than North American sales. With the Chinese market being so sizable, there’s definitely room for Nike to keep growing as they increase their presence.
Debt is important when assessing liquidity. Nike has $11B in debt, but the nature of a company’s debt is important. Nike’s debt is long-term, meaning it’s from banks (credit lines, bonds, etc). This is encouraging because they’ll have fixed-term payments to make rather than other types of debt like debentures which can cause drastic drops in the share price.
It is notable though that Nike pays $453M in interest yearly. This number will decrease as the company pays down the principle but it does decrease liquidity.
Adidas, for comparison, has $13B long term debt but only pays $173M in interest. This is because the company has issued debt through bonds, the best way to raise money at the lowest cost.
Nike, on the other hand, has a $2B credit line with a bank. The more Nike withdraws, the more interest it pays, whereas Adidas simply pays interest on bonds due to its credit rating which is A+. Lower interest payments, more liquidity and security.
Under Armor has $2.75B of long term debt but has paid $93M over the last year, indicating its debt is expensive in comparison to the other two.
Lastly is EBITDA, a favourite of bankers everywhere. This term stands for earnings before interest, taxes, depreciation and amortization.
EBITDA allows you to value a business. The ITDA of EBITDA are adulterants in your analysis, and accounting tricks can affect the way we assess a company’s “value.” By removing them one can get a fuller picture of a company’s value and how easily it can cover interest payments after restructuring, though Nike isn’t likely to be purchased anytime soon.
Nike’s EBITDA is $1.4B, more than enough to cover its yearly interest payments.
There are a number of ways to measure a company’s value as an investment which we didn’t cover here, entire volumes on the subject have been written, but the point is analysis is an ongoing and rigorous process.
These apparel companies are all similar in that they have low debt, are relatively expensive, they benefit from positive consumer sentiment and are established companies. To differentiate them from competitors, we have to go beyond that and use other metrics like macro trends.
Nike may be forced to abandon its Chinese suppliers if the U.S.-China trade war continues, and that would have a significant effect on the company’s earnings per share.
So here’s what we know:
- Nike is liquid enough to cover its liabilities
- Its stock is expensive and trading at a premium
- Its debt is sizable but benign
- EBITDA is healthy
- Revenue is growing
- Supply chain reliance on China is a vulnerability
These points should be taken in consideration in conjunction with one’s risk tolerance before putting money down. If you feel the trade war is ramping up, and don’t feel comfortable with that risk, then Nike might not be the stock for you. In the end, only you can determine risk tolerance.
But blue chip stocks’ safe but usually low-return securities, are an important part of any portfolio. Established companies like Nike won’t see their SP double overnight, but experienced management should prevent it from halving.
It’s the high-risk $0.10 stocks where money is made (and lost). Each sector has its peculiarities and unique line items to look out for–fair value of biological assets for example in cannabis–but luckily we analyse small cannabis companies and show you how to every day here at Equity.Guru.
Keep an eye on your inbox for the next issue of our investor series.
–Ethan Reyes