

With the beginning of a new year, I look forward to Cambridge House’s Vancouver Resource Investment Conference. A conference which has played a major part in my investing/trading career. It was the first ever financial conference I attended way back in the day when I was a young man. At that time, I was one of the few without gray hair in the audience. Now VRIC sees more young people which to me indicates the increasing popularity in commodities.
What am I looking forward to? The sentiment of CEOs. Last year, the sentiment was hopeful. Both gold and silver were near support, and even I was telling CEOs that there were still room lower for commodities (especially silver!) to go. 2023 is looking more promising. From a technical analysis point, gold and silver and many commodities look strong. Even better when you add the fundamentals.
Silver and uranium will be hot at this conference, but let’s face it, gold will be the dominant commodity discussed. Before we get to the technicals, let me update you on some fundamentals.
Just recently, I wrote my gold 2023 outlook. Early in the year, but many of the fundamentals and technicals are already panning out. Gold markets are rising due to a few reasons.
The mainstream market explanation for gold prices rising: analysts expect gold prices to rise due to recession, stock market valuation risks, and the eventual peak in central bank rates. Putting it another way, gold will rise as the trajectory of monetary policy enters the more ‘dovish’ side of things. That Fed pivot that most analysts are looking for.
Gold is rising in anticipation of a dovish Fed in the February 2023 meeting, and an eventual cutting of interest rates as a recession approaches. If the Fed maintains its hawkish stance and ‘stays the course’ to keep interest rates high even in a recession, then expect volatile moves not just in gold, but also the stock markets.
But there is one more reason why gold is rising. Chatters online about China piling up gold.
The People’s Bank of China (PBoC) increased its gold holdings for the second consecutive month. The PBoC raised its holdings by 30 tons in December and 32 tons in November. China now reports holding 2,010 tons of gold. During the third quarter, central banks purchased a record 400 tons of gold. Central banks’ total reported gold holdings are a record 36,745.8 tons.
Some would argue major central bank buying, but one must ask why is China leading the pack. The simple answer is war. The Chinese have seen what happens when you go to war. The Russians saw about $300 billion of their reserves frozen by the US. Russia is holding up because their central bank has been buying gold. Since sanctions have been imposed way back in 2014, as the Ruble depreciated against the US Dollar, Gold vs the Ruble has appreciated.
This has led to fears of China preparing for an invasion of Taiwan. If China invades Taiwan, then they know their reserves will be frozen. The Chinese have been slowly selling off their US and EU debt since 2021. They know during a war those will be frozen. The US cannot do anything about gold. Just something to consider.
Many of the gold bugs hold onto gold because they believe the world is going to sh*t. One could argue they have a valid argument given everything that is happening: inflation, interest rates, war, food prices, the debt ceiling, and I am sure I missed a few others. In times of volatility and potential chaos, money will likely go to cash. In this age, we are talking about the US dollar being the safe haven reserve currency. But if the US has problems, the dollar might not look as safe as it once was. What’s the safe haven for the US dollar? The Japanese Yen and gold.
Now, let’s discuss the charts. I wrote about gold breaking above $1900 and why this was crucial. More importantly, gold prices broke above a major weekly resistance zone.

Gold had a major breakdown back in September 2022 when gold broke below $1680. I was expecting a move down to $1500 as long as the price remained below $1680 which now acted as resistance.
Instead, gold did not sell off. Gold actually closed back above $1680 confirming a false or fake breakdown and a reversal. This was very bullish. The next resistance zone comes in at $1975.
Gold on the daily chart is just running away. As a trader, I would wait for some sort of pullback to get in. I don’t recommend chasing. We may not pullback now, but I would love to see one. Perhaps we just rally up to $1975 before we do pullback. If that is the case, I will remain patient.

In that article, I also highlighted the gold/silver ratio. I use it in a simple way:
When the gold/silver ratio heads higher, it is time to buy silver since silver is cheaper.
When the gold/silver ratio heads lower, like it has now, it is time to buy gold since it is cheap.
With the gold/silver ratio turning, it is hinting at a move in gold, or else, a drop in both gold and silver.
Notice I used the word gold markets in my title. Markets with a plural. I think many traders and investors just focus on gold/usd, but other gold charts show you how strong gold is.

Gold against the Euro recently broke out of a trendline just two weeks ago. It looks bullish above 1700. 1840 is the next target as long as we hold above the broken trendline.

Perhaps the most interesting gold chart is gold against the British Pound. We were just a few pips away from confirming new all time record highs! Instead, gold/gbp rejected the resistance zone for now. As long as we remain above 1500, a breakout into all time record highs is still in play.

Gold against the Australian Dollar just recently broke out. Currently, the price is retesting the breakout zone.
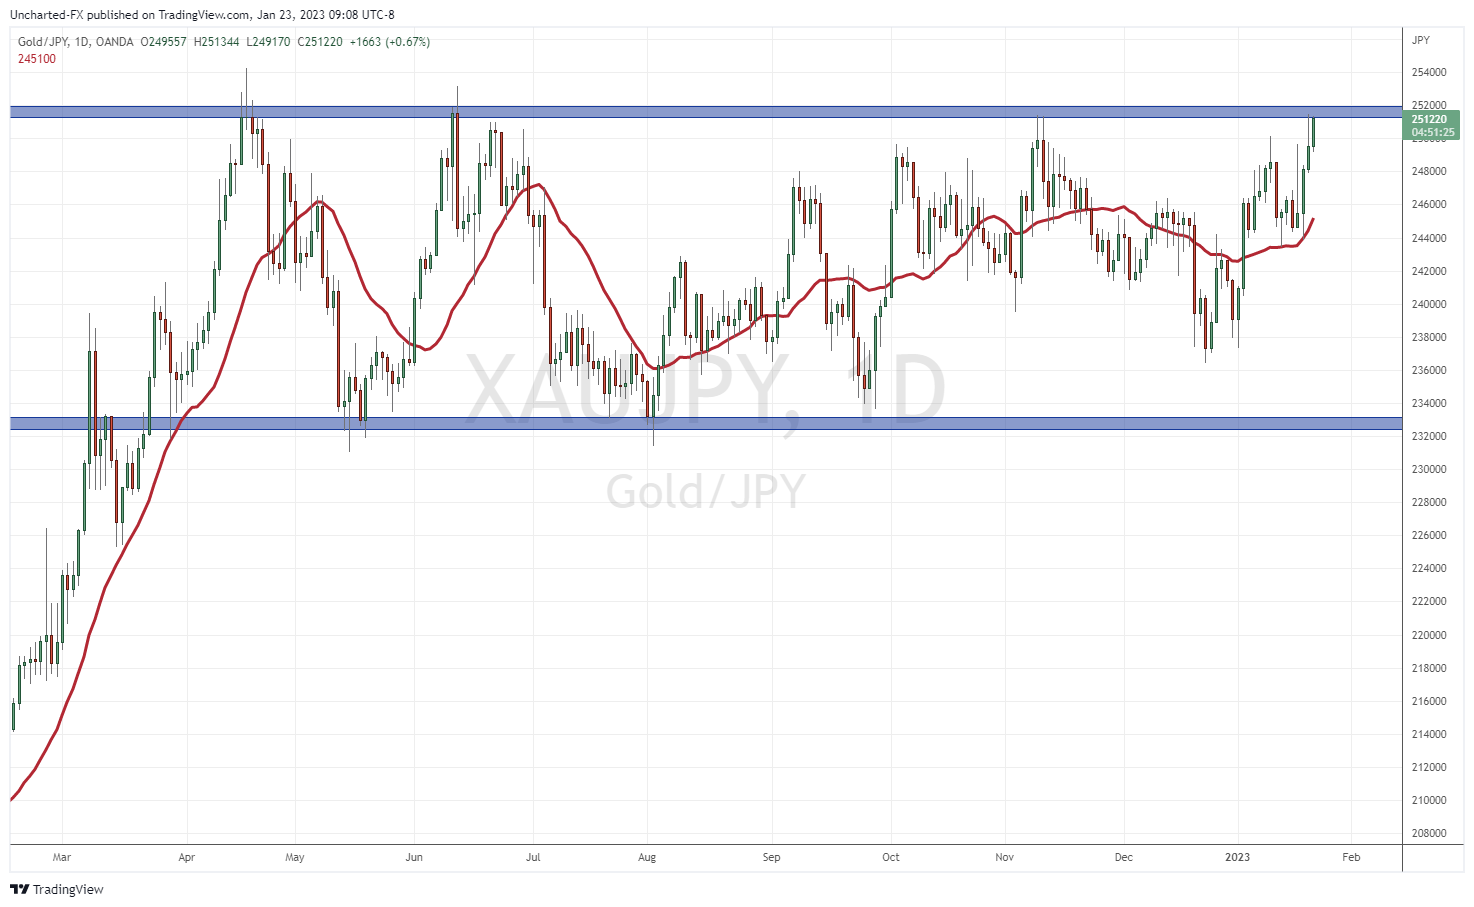
Perhaps where gold will make new record highs against a fiat currency will be against the Japanese Yen. Just like gold/gbp, gold,jpy is pretty much testing the resistance preventing it from printing all time record highs. The Bank of Japan did not surprise markets last week, but markets still believe they will need to act. That might just mean gold/jpy continues to range here.

Gold against the Swiss Franc is one of the best technical set ups according to my criteria. We had a long range from Summer 2022 till 2023. The breakout above 1700 finally happened which has triggered a new uptrend. I expect another higher low which means we will take out recent highs here at 1780.

Finally, gold against the Indian Rupee is also on the verge of printing new all time record highs. But just notice the strength with the slope of the uptrend. It has just kept climbing higher and higher.
The gold markets are kicking the year off strong. The debate is what does this all mean? Is it due to an eventual Federal Reserve and central bank pivot? Or is money preparing for some black swan/volatile event?
Whatever the case, this year’s sentiment at VRIC should be one of excitement and overall bullishness.