
The Fed shook markets last week with a hawkish Powell claiming that the Fed will do its job to tame inflation even if it means taking interest rates higher. The average Fed Funds futures for 2023 has already jumped from 4.50% to 5.00%. But volatility is not done.
Earnings have been a bit of a boost for markets but in reality, it is all about interest rates and inflation. The most telling sign for earnings season was whether or not US corporations were signaling weaker forward guidance due to a strong US dollar and a global economic slowdown.
This week we have the US mid terms on November 8th 2022. The Republicans are predicting a red wave. Americans aren’t really happy with higher gas prices and living costs, and analysts believe they will look for a change by voting in the other side. The Democrats are defending their narrow majorities in Congress. According to mainstream media, the Democrats are betting that a backlash against the Supreme Court’s reversal of Roe v. Wade will save them.
What happens here won’t just impact the US, but will impact the world. Some geopolitical analysts are even claiming the Russians are turning up the heat in Ukraine right now because when the Republicans gain the majority in congress, billions of US aid won’t flow to Ukraine. Ukraine could lose a major source of aid.
To add more volatility this week, we have US CPI for October released on November 10th. If inflation shows signs of falling, it will add more hope that the Fed will begin to taper soon. If inflation remains strong or comes out higher… markets will feel it.
All of these data points and events are testing the theory that the stock market (S&P 500) has some of its best returns from October-December:

As a technical trader, this is one of those rare times when the markets I am following have different signals. To me, this just indicates the volatility and uncertainty. As a trader, I sit on my hands or trade other assets which have a technical pattern I can work with. This is how I have survived in the game for a decade. I only trade setups which meet MY criteria for high probability setups.
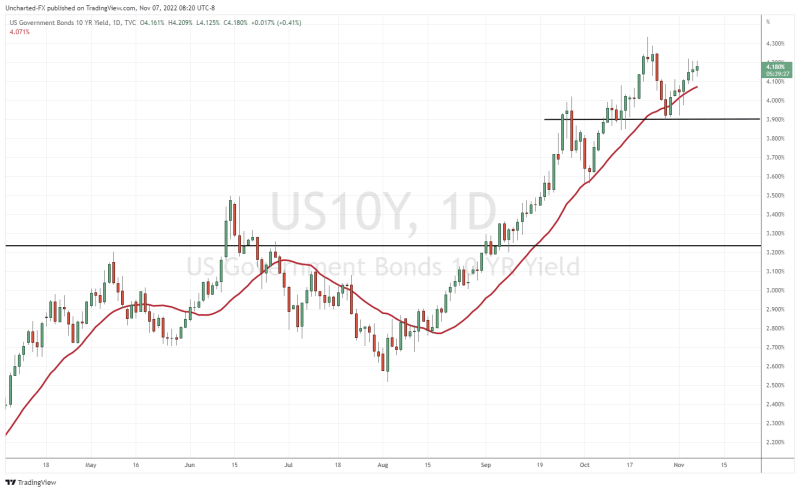
Let’s start with the big one. The 10 year yield is what we watch to determine where the markets are going. If yields rise, stock markets will fall. The 10 year yield remains above 4% and climbing towards recent highs. Are we set for a breakout? If you think the Fed raises rates higher then yes. But if you think the Fed is ready to slow down and pivot, then we could see a reversal here which means higher stock markets.
The 10 year is in no man’s land right now. It does appear more likely that it will drop, but for a trend change, I would need to see this to close below 4%.
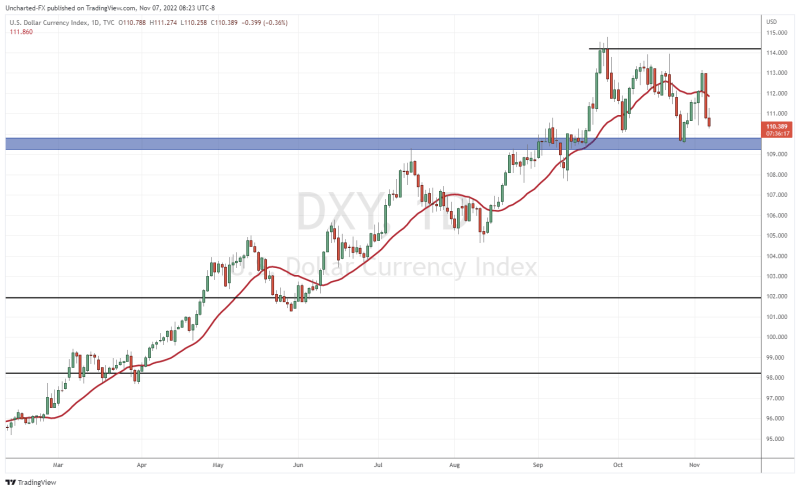
The same goes for the US Dollar. Weak right now, which is great for stocks. However, the dollar could just be dropping to support in a range. If the range holds or continues, the dollar would bounce from the 109.50 zone. If we break below this 109.50 support, then it gets very interesting.
The reasons for a dollar move? It could be due to a dovish Fed, but there is another dollar fundamental to remember. It is the safe haven reserve currency. When there is fear in the world, money will flow into the dollar. If you look around Asia and Europe, you can see why money from these continents would want to flow into the US dollar. If we see some fear due to a geopolitical event, the dollar will continue its uptrend.
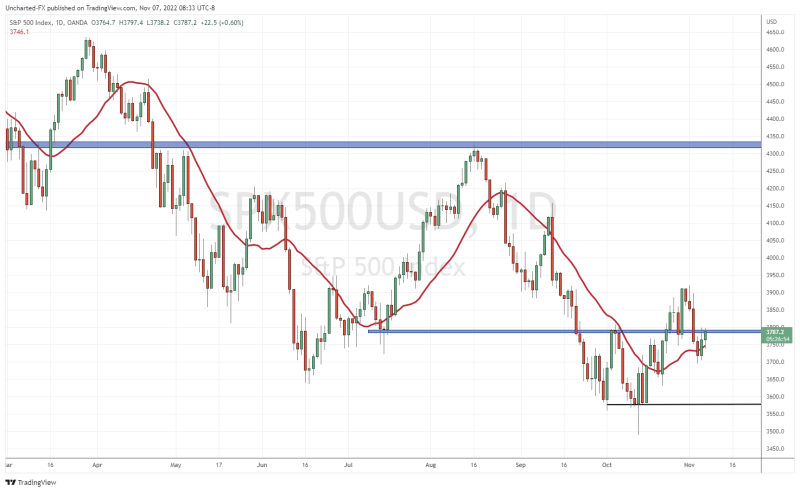
The S&P 500 had a major breakout above 3800. It looked good with buyers stepping in on the retest and driving the S&P 500 higher on a solid 3.4% pop day. However, post Powell, the S&P 500 closed back below 3800. This is what we would call a false or fake breakout.
I don’t have much to say on the S&P 500 right now unless we get a close above 3800. Even then, I personally would wait to enter long until we climb above recent highs at 3912. Currently, 3800 is resistance.
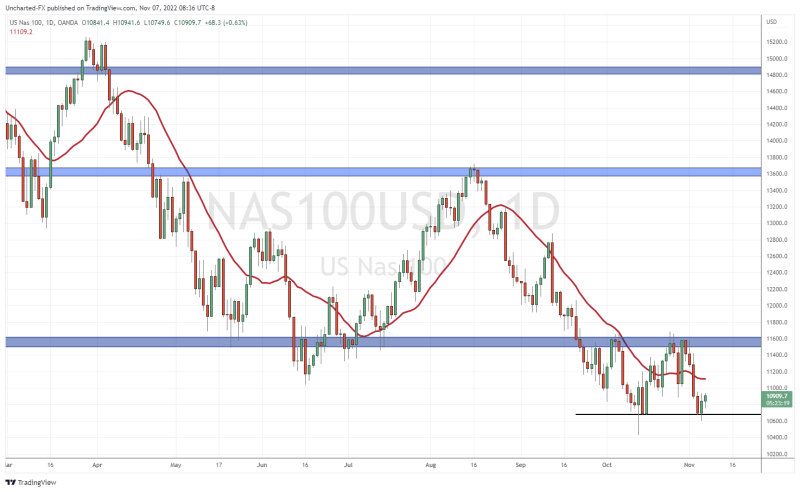
I am keeping close eyes on the Nasdaq because it is meeting my criteria for a possible reversal. A double bottom pattern could be forming which is a very strong reversal pattern. However, the breakout trigger comes in with a close above 11,600.
Tech stocks see more pain when interest rates are rising due to the fact many of them aren’t making a profit. They take out debt, which gets more expensive as rates rise. This eats into their financial statements.
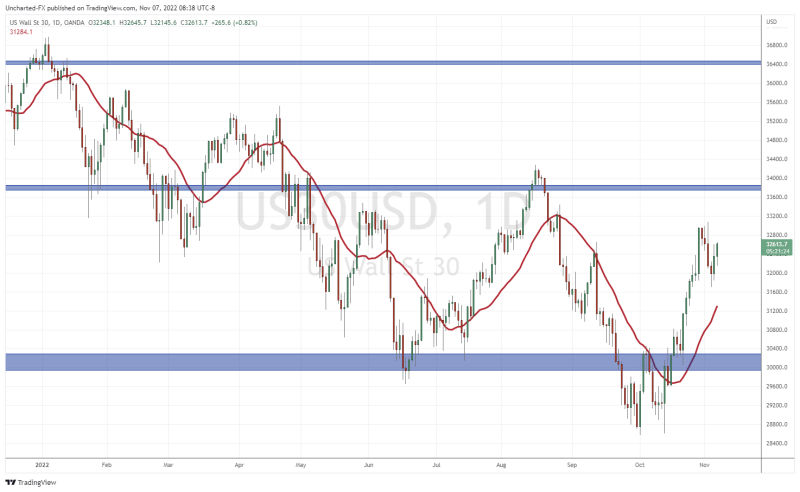
The Dow is the strongest, and requires some thinking. We called the breakout weeks ago and went long taking profits before the Fed. Another higher low could be on the way as the Dow continues its uptrend.
Now to the thinking. Why is the Dow so strong? Months ago, I spoke about the Dow being stronger as investment money runs into VALUE stocks. The Warren Buffett approach. Fear and uncertainty? Put your money in solid companies which pay a dividend. These dividends technically might even yield more than putting your money into bonds with the added bonus that the stock could move higher. This is how investment money is thinking, and why I think the Dow could continue to be the stronger of the major indices.
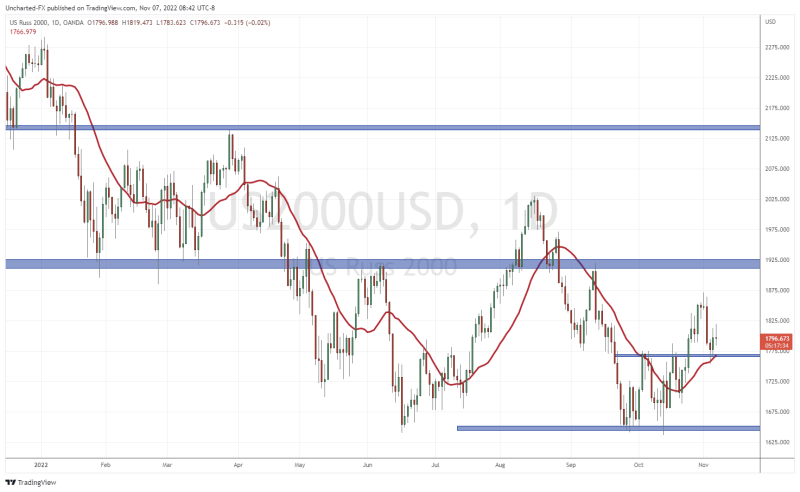
After the 10 year yield, I look at the Russell 2000 as the leading indicator for US major indices. The Russell moves first, and other markets follow.
From a technical perspective, the Russell is still holding the breakout zone of 1775. We are currently retesting this zone and the bulls are jumping in for now. As long as we remain above 1775, another leg higher is possible. As long as the Russell holds above 1775, the other major market indices can rise further.
So there you have it. A lot of uncertainty right now and as traders, we just need to be patient and wait for breakouts or breakdowns. Be careful as many headlines right now are fueling an “equity rally” due to US midterm results. My eyes remain on the 10 year yield and the US Dollar.