
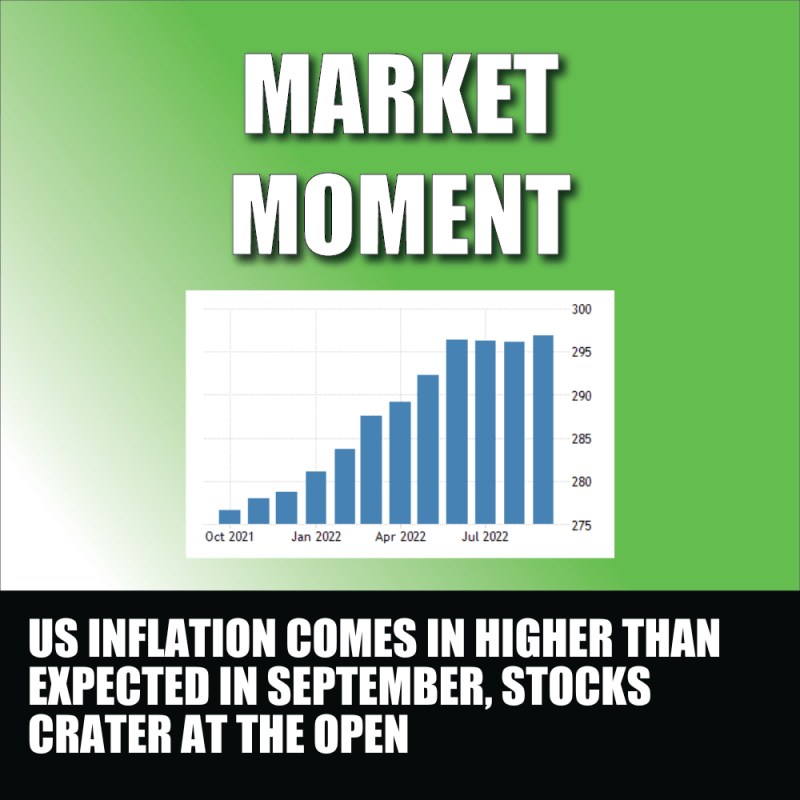
Just yesterday, PPI came out stronger than expected. I told readers that I am a PPI guy, and how one can use this data point to predict future inflation. PPI tells us what is coming on the consumer side of things. It came as no surprise that the Consumer Price Index (CPI) for the month of September 2022 came in higher than expected.
Inflation continues to persist even with the Fed taking interest rates up to 3.25%. Cleveland Fed President Loretta Mester came out on Tuesday saying that, ” “there has been no progress on inflation.” The reality is that interest rates need to go higher than the rate of inflation. Expect interest rates to head much higher unless we get some kind of major demand killing event.
CPI for September increased by 0.4% for the month, beating expectations of 0.3%. On a 12 month basis, inflation was up 8.2% (under the June highs of around 9%) but still is hovering near the highest inflation levels seen since the early 1980s.
If we exclude food and energy, core CPI came in at 0.6%, higher than the Dow Jones estimate of 0.4%. Core inflation was up 6.6% from a year ago and is the biggest 12 month gain since August 1982.
Food prices were up 11.2% from a year ago. Energy prices actually declined 2.1%, but October is seeing energy move higher. Shelter costs, which makes up one-third of CPI, are up 6.6% from a year ago. Average hourly earnings declined 0.1% for the month on an inflation-adjusted basis and are off 3% from a year ago, making this bad news for most workers.
“The Federal Reserve has made it very clear they’re committed to price stability, they’re committed to reducing the inflationary pressures,” said Michelle Meyer, chief U.S. economist at the Mastercard Economics Institute. “The more inflation comes in above expectations, the more they’re going to have to prove that commitment, which means higher interest rates and cooling in the underlying economy.”
This is what it really is about. Many traders have been pricing in a Fed pivot, but I have been saying here on Equity Guru to hold your horses. The Fed has been adamant in saying that interest rates will need to go higher and remain high for a long period of time to tame inflation.
With this print, you can lock in a large 75 basis point hike from the Fed in three weeks time. I will be watching Fed fund futures and the bond market to determine whether the markets think the Fed hikes higher with say a 1% hike.
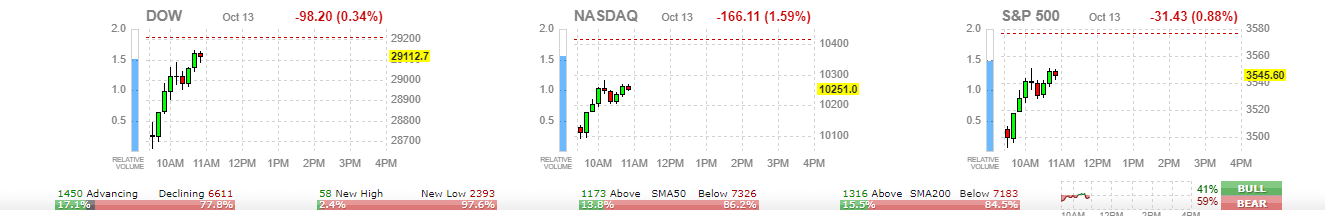
After opening red post CPI data, the markets are slowly recovering on the intraday. Traders will be watching to see if the markets can flip green.
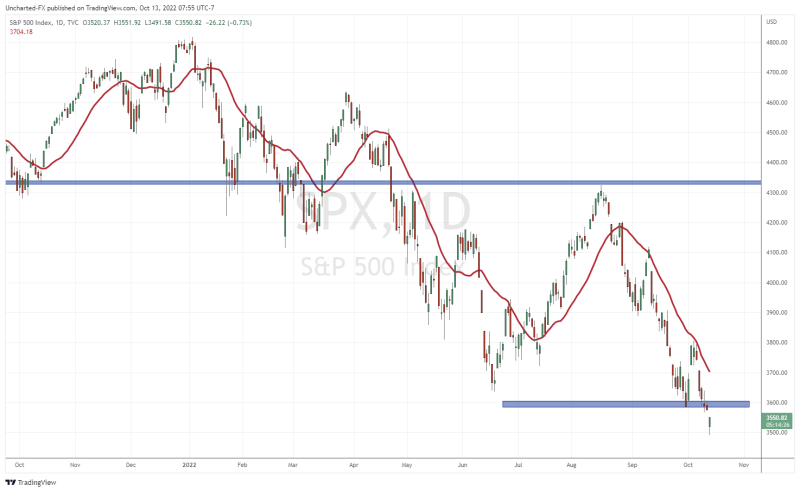
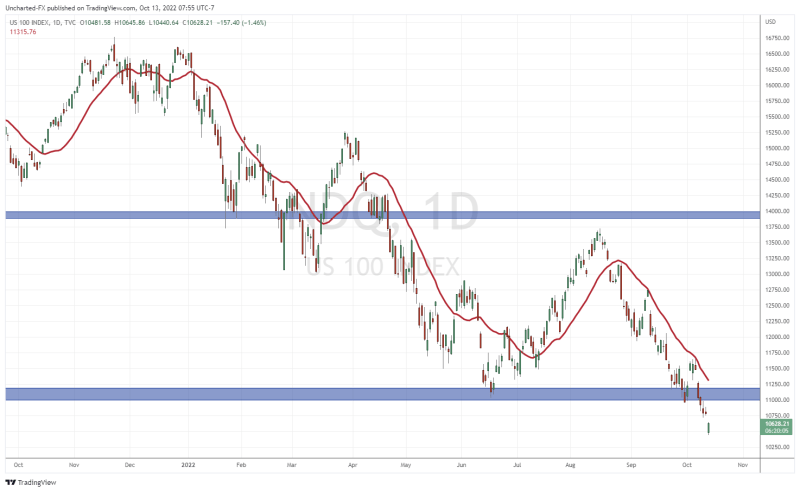
However, on the daily charts, the S&P 500 and the Nasdaq are breaking below previous lows. A move higher would just set up a retest of current resistance where sellers would likely jump back in. 3600 on the S&P 500 is the price level I will be watching in the coming days.
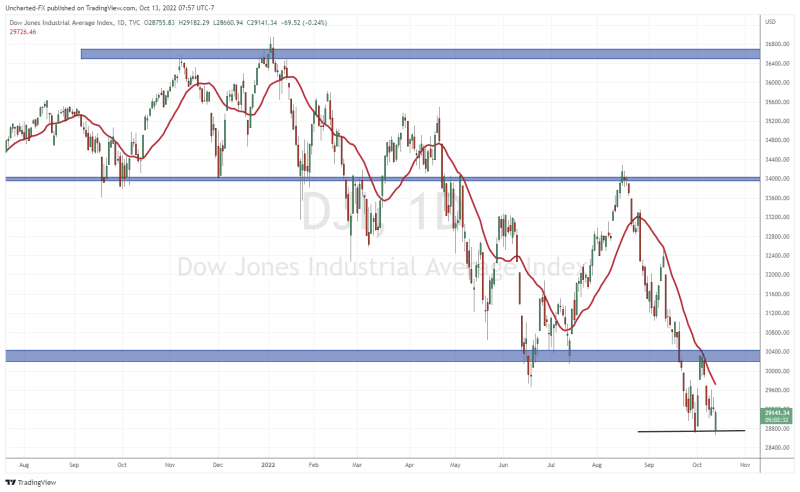
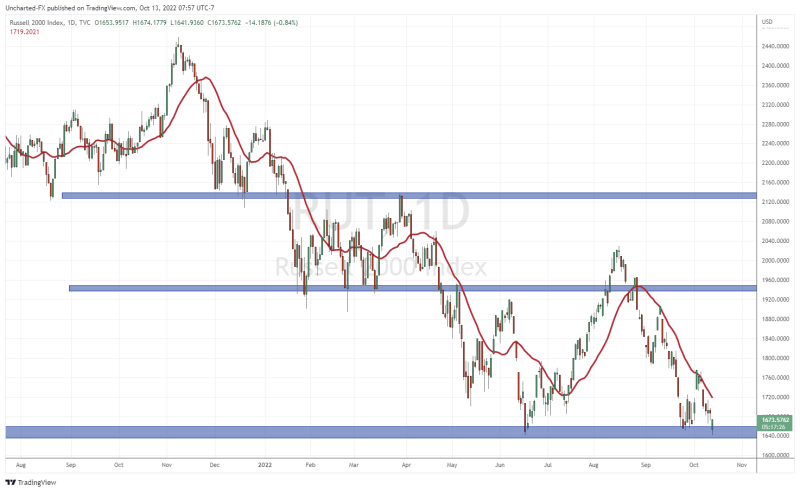
Meanwhile the Dow Jones and the Russell 2000 are still holding above their recent lows. If you are someone bullish on equity markets, then these charts show some promising signs of the markets recovering as a whole.
But of course, we here at Equity Guru have been looking at two charts. These two charts have been our tools to determine where stocks are going.
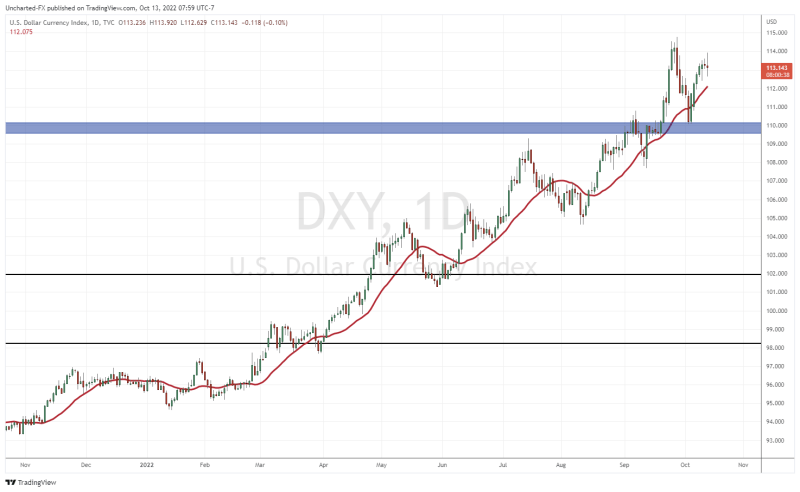
First the US Dollar chart, which rises when Fed rate hike expectations increase… or some would say the dollar is rising due to all the uncertainty in the world. A positive for bulls is that the dollar has given up its earlier gains. This increases the likelihood of a market bounce.
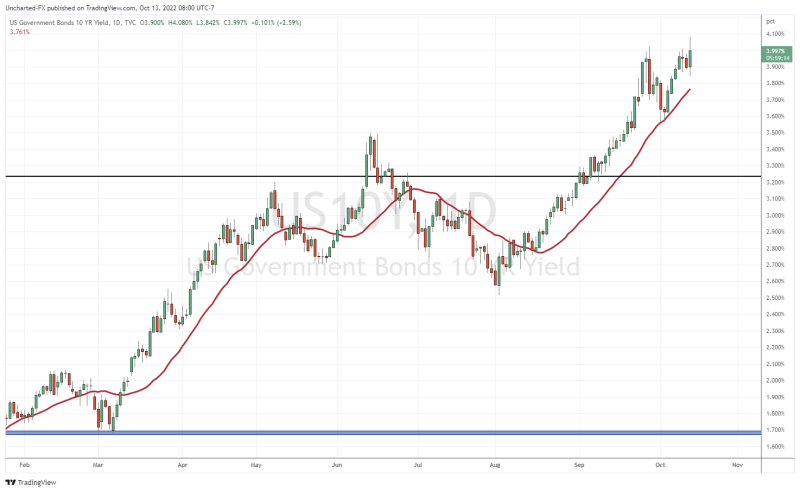
But the 10 year yield remains the important chart in determining where equities are going. The higher this goes, the more pressure it will add to stocks. Earlier this week, the 10 year yield was showing signs of a double topping pattern and was ranging at recent highs. This is positive for the stock markets.
With today’s CPI print, we saw the 10 year yield spike, and was at one point over 4%. This is what puts pressure on stocks. Now, we are seeing a slight pullback and yields are back under 4%. If we do not get a strong green candle breakout on the daily close, then I think markets will have a very strong chance of recovering.
There is still a lot of time to go in the trading day, and for the markets to digest the CPI data. If I had to choose one chart to watch, it would be the action on the 10 year yield.