
A week full of US economic data. FOMC minutes come out later today. We get the big US CPI for September data coming out tomorrow (Thursday October 13th). We round out the week with US retail sales on Friday October 14th. All of these data prints will change people’s perspectives regarding interest rates and if the US economy is weakening and heading into a recession.
We did have the US Producer Price Index (PPI) come out today. This data point doesn’t get as much hype as it should. People rather focus on the Consumer Price Index (CPI).
The PPI measures the average change over time in the selling prices received by domestic producers for their output. The prices included in the PPI are from the first commercial transaction for many products and some services.
I am a PPI guy. A few years ago I heard something from Frank Holmes, the head of US Global Investors, which changed my perspective. Mr. Holmes says PPI is more useful for predicting the future of inflation. Think of it as driving a car. When you look through the rear view mirror behind you, you are looking at CPI. When you look straight ahead through the windshield, you are looking at PPI. PPI data will tell you whether CPI will remain strong or not.
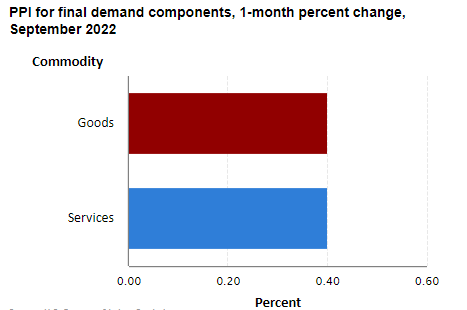
PPI data for September came out today. PPI increased 0.4% for the month higher than the Dow Jones estimate of 0.2%. In other words, wholesale prices rose more than expected (despite the Fed’s efforts to control inflation!) and these costs will be passed along to the consumer.
The good news? On a 12 month basis, PPI rose 8.5% which is a slight deceleration from the 8.7% August highs.
If we exclude food, energy and trade services, PPI increased 0.4% for the month and 5.6% from a year ago. Food prices lead the way with a 1.2% monthly increase, followed by energy which rose 0.7%, but is down from massive gains the previous two months.
PPI comes a day before the big CPI data. But what does this all really mean? That the Federal Reserve still has work to do in order to tame inflation. In three weeks time, it is very likely the Fed will hike another 75 basis points… and maybe more once we see how CPI data turns out.
Cleveland Fed President Loretta Mester has definitely been a hawk. She said yesterday that, “there has been no progress on inflation.” The reality is that interest rates need to go higher than the rate of inflation.
The markets seem to think that the Fed will just pivot once the economy begins to slow down, but the Fed continues to say that interest rates will have to remain high for sometime. I would be a bit cautious. Even JP Morgan CEO Jamie Dimon came out saying that the stock market could still drop a further 20% as the Fed continues to raise interest rates.
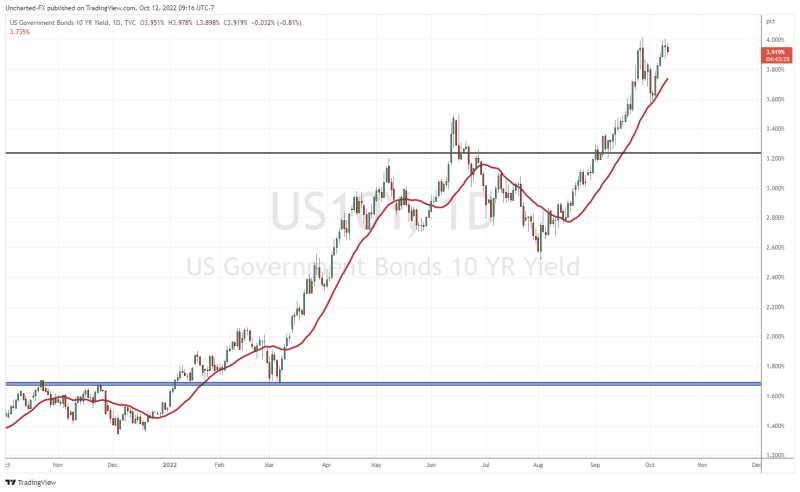
As always, I continue to watch the chart of the US 10 year yield to gauge where the equity markets will be going. It does appear like a double top could be forming. When the 10 year drops, stock markets move higher. If the 10 year yield remains stable, or ranges as it is right now, stock markets pop green. When the 10 year yield rises, it puts pressure on equity markets.
The good news is that we may see the equity markets bounce in the next few days and weeks. The bad news? The 10 year yield still remains in an uptrend, and a drop would just be a pullback or relief move in an uptrend.
Yields can move higher and you will see volatility in this chart when CPI data is announced (like October 13th!) and when during the FOMC press conference as the market determines where interest rates are going.