
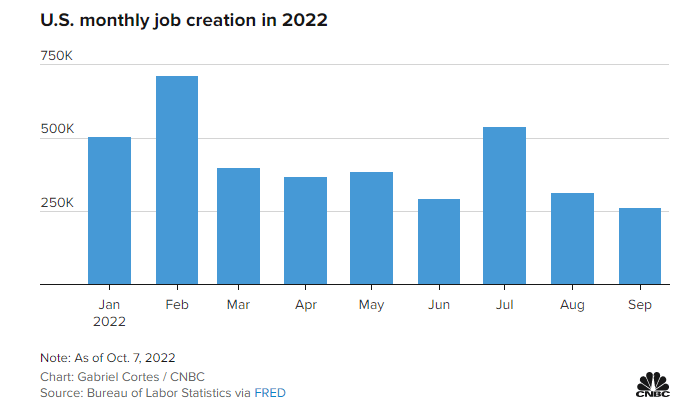
The highly anticipated US non-farm payrolls (NFP) for September have come and gone. We got a bit of a mixed labor data. Job growth fell short of expectations. NFP increased 263,000 for the month compared with the estimate of 275,000. The real talking point is the unemployment rate. The unemployment rate came in at 3.5% versus the forecast of 3.7%. The participation rate fell lower to 62.3% and the size of the labor force decreased by 57,000.
Overall, the September 263,000 print was much lower than August’s 315,000 print and tied for the lowest monthly increase since April 2021.
“Depending on your view of optimism vs. pessimism, on the economy, there’s a little bit of something for everyone in this report,” said Liz Ann Sonders, chief investment strategist at Charles Schwab. “Obviously, the market is not happy, but the market is not happy in general these days.”
So what does this all mean? The reason why these numbers were closely watched was because they would provide some insight to the next Fed rate hike. And markets are pricing another large hike.
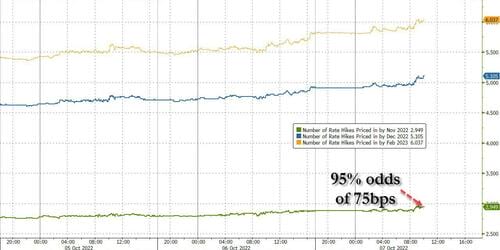
“This puts the nail in the coffin for another 75 [basis point rate increase] in November,” said Jeffrey Roach, chief economist at LPL Financial. A basis point is 0.01 percentage point.
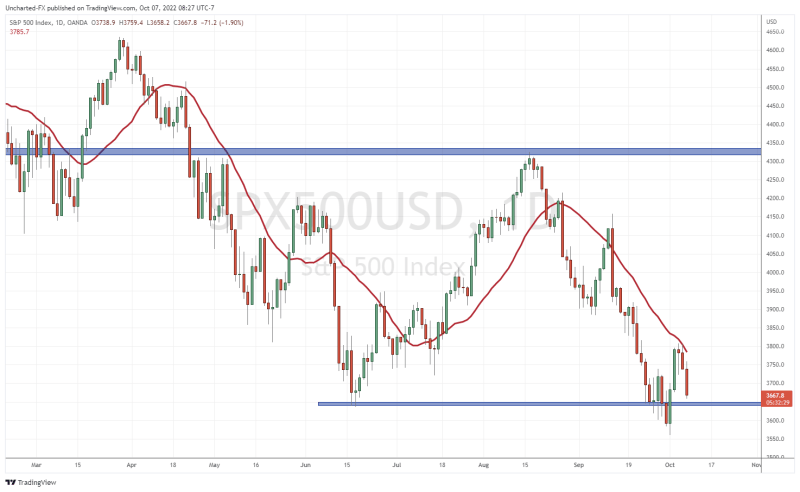
Equity markets are falling as the chances of a large Fed rate hike increases. As we said, do not bet on the Fed pivot trade.
The S&P 500 and other equity markets have rejected my moving average and the big question is whether they will take out the recent lows. If they do, that’s when I go short. For now, US stock markets can just range here.
But as my readers know, there are two other charts we watch to determine where markets are going. Both have moved post NFP.
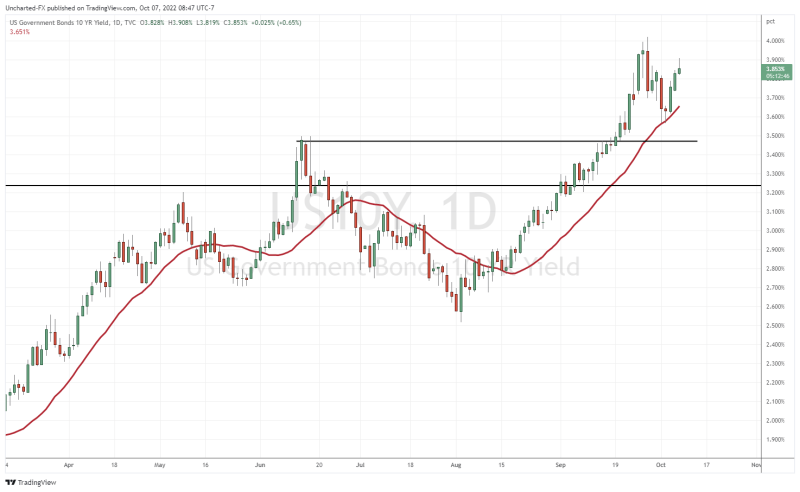
The US 10 year yield popped a bit but is now giving up the earlier gains. A pullback is still possible. The next move higher could occur once the Fed hikes in November and then maintains a hawkish tone signaling more rate hikes.
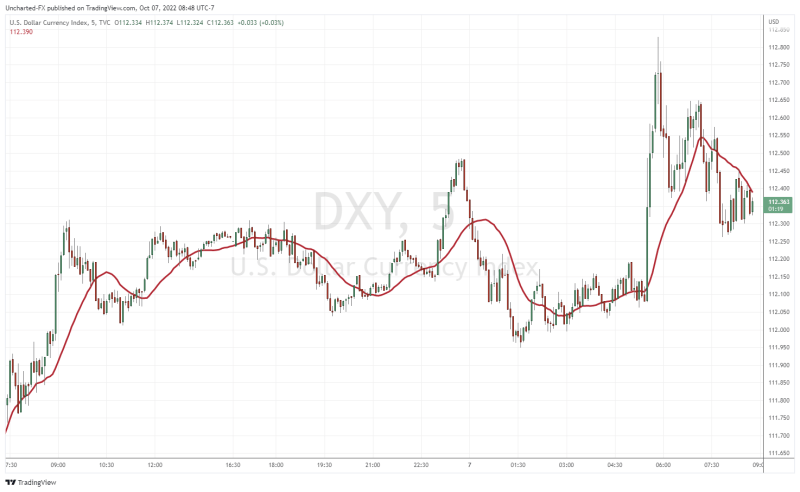
The dollar chart is what I was watching. Above is the 5 minute intraday chart. Can you guess when the NFP announcement came out? A major pop in the 25 minutes post NFP, but now the dollar is slowly giving up those intraday gains.
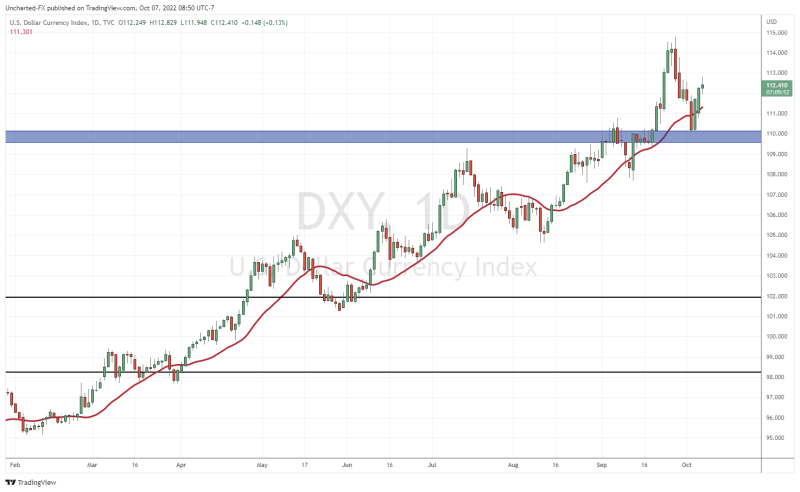
On the longer term chart, 110 still remains the key level. Note that market structure looks very similar to that of the 10 year yield chart.
In summary, today’s mixed NFP report has the marketing thinking that another rate hike is coming. Recall that Jerome Powell said that there isn’t a recession because the labor market is doing fine. Once the employment data really begins to disappoint, that’s when we could see a stronger case for the Fed pivot trade.