
As US stock markets continue to grind away at major support, a major technical trigger has developed and confirmed on the longer term charts.
Longer term charts give us a better indication of the overall trend, and provide us with better signals than the shorter term charts. I always tell readers to focus on those charts. The thing which deters most traders is that these longer term charts are slow. A weekly and monthly time frame candle covers many days. When technical patterns break down, a relief rally and retest may take weeks or months to confirm. Meanwhile on the shorter timeframe, it will appear as if a new uptrend is starting but it really is not.
There has been one pattern which initially triggered a few months ago, but just completed its confirmation at the end of September.
The S&P 500 just confirmed the kiss of death signal on the monthly time frame.
What is the kiss of death?
This signal occurs when the S&P 500 drops from all time highs and closes below its monthly 21 exponential moving average (EMA), then bounces to its 21 EMA and subsequently drops again below its recent low (the low it made just before the bounce).
The kiss of death triggered in the years 1929, 1969, 1970, 2000, and 2008. This pattern triggered a long term bear market. Will it do the same now?
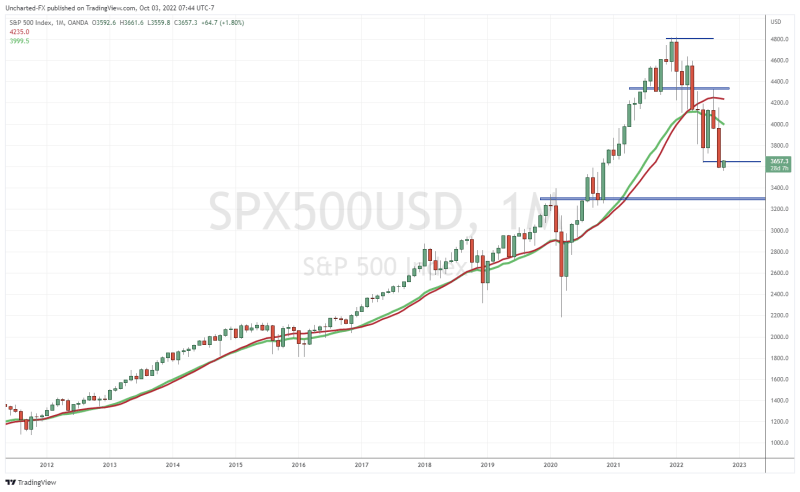
The kiss of death is shown above on the monthly S&P 500 chart. The 21 EMA is the thick green line. Price broke below it in June, we then saw a rally in July. That July rally really looked like we were going to get a kiss of death fakeout and false trigger. Instead, we weakened in August, and then September closed below the low it made just before the bounce. Our trigger.
For experienced technical traders, this is a lower high on the monthly chart. It is really our first lower high on the monthly chart ever since we broke down back in April 2022. Generally, we expect at least 2 lower highs in a downtrend. Which means more lows are coming unless we can get a close above August’s monthly candle (4340) on the monthly chart.
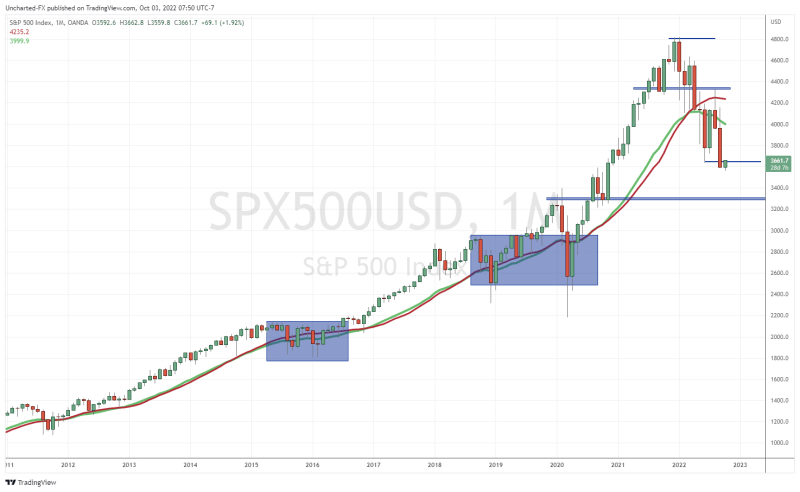
I have also highlighted in blue occurrences when the kiss of death fails. Note that we did indeed break below the 21 EMA back in 2016, 2019, and 2020. The retest (pop higher) played out but there were no new lows formed which confirms the kiss of death trigger. 2022 is different.
But don’t worry, I have one positive to share with you all. The major sell off might not happen just yet.
Going back and looking at the kiss of death triggers back in 1929, 1969, 1970, 2000 and 2008, there is one common thing. Once a kiss of death triggers on the monthly chart, we tend to see 2-3 months of gains before the major sell off occurs. Essentially, a pullback before the sell off and longer term bear market really gets going.
I am writing this article in October 2022. Two-three months takes us to the end of 2022 and the beginning of 2023.

As you can see, historically the markets perform well from October-December and January isn’t too shabby. This fits in well with the kiss of death 2-3 month recovery before sell off.
In summary, according to technicals, prepare for a longer term bear market in stocks. This is not the bottom, even though we are due to a relief bounce. As long as we remain below 4340 on the S&P 500, more new lows are coming. In terms of fundamentals, there are a lot of things which can put more pressure on markets including more interest rate hikes, chaos in bond markets (England anyone?), currencies collapsing (hello England once again, but let’s not forget about the Euro and Yen), and of course, the pending energy crisis in Europe when Winter arrives.