
Perhaps the better title would be the double ‘P’ sell off. Many market analysts and financial media are calling yesterday’s price action the Powell and Putin selloff.
Putin has upped the ante in Ukraine. Russia is calling up more reserves for the war and areas of Eastern Ukraine that Russia holds will be holding referendums to join Russia. You have probably seen headlines of Russians protesting and apparently how “how to leave Russia” is the top search in the country. We will have to see if the war does pick up. Surely, this will impact things such as wheat prices, natural gas and oil. But the market only reacts to this conflict if it senses that this war could expand from Ukrainian borders. The risk rises if the market thinks this turns into a larger European conflict.
I am not trying to downplay the war. Escalation is something to watch and could impact markets. But as of now, the story remains inflation and interest rates.
Stock markets shifted from the inflation narrative to recession. We saw markets begin to pop when this occurred. But then higher inflation data and no official recession saw markets shift back to the inflation narrative. Stock markets have been under pressure ever since.
The important thing to note: Many traders have been betting that the Fed (and other central banks) will pivot and start cutting interest rates due to recession. This is not happening, and the Fed is persistent in saying that rates will have to rise. Many believe the Fed could begin cutting interest rates next year. The reality is the Fed wants to keep rates high for a long time in order to bring down inflation.
It really is a game of chicken, and will continue to be. Going forward, more people will be talking about high interest rates causing an economic slowdown and the Fed having to cut interest rates. But will the Fed persist in maintaining interest rates high?
So what changed from yesterday’s Fed statement? The median forecast data is what everyone is talking about:
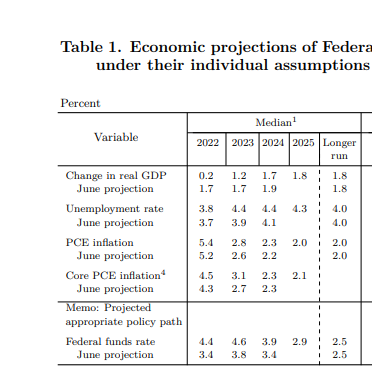
Above is the median data from the Fed’s latest projections. The full data set can be seen here.
The Federal Funds rate projection near the bottom is what has markets talking. The median rate for 2023 is now 4.6%. In the previous Fed statement, this was 4.50% so we have had a 0.10% increase from the Fed. Some might not see this as overly hawkish, but remember this is the median rate for 2023. Depending on inflation, this number may have to be adjusted. The Fed funds is now at 3.25% after yesterday’s 75 basis point hike. This means we still have ways to go before we hit 4.60%.
The bond market is where the real action is happening.

The 2 year yield is hitting 4.14% at time of writing. This is the highest yields have been since 2007. The short end of the yield curve is closely related to the Fed and Fed Funds.

Readers know that the 10 year is my preferred chart for predicting where the stock markets are heading. We have just had a major breakout days before the Fed decision. I warned readers that unless this breakout turns out to be a false breakout, markets would be heading lower as the 10 year continues higher.
It indeed is moving higher. We have a typical breakout and retest which is now seeing the 10 year yield hitting 3.69%.

On the topic of “technical breakout, retest and continuation”, the US dollar is doing the same thing. Buyers are stepping in on the US dollar pullback. I was one of them.
110 is the key level on the DXY and as long as we remain above, expect further dollar strength. Something backed by a hawkish Fed and higher yields.
This combo of higher yields and a stronger dollar is hitting stocks.

All the technical levels I highlighted for readers earlier this week are in play. I notified readers that the Monday move was nothing more than a pullback to resistance at 3900. We really needed to break above 3900 for further upside.
Instead, sellers stepped in at resistance and we got a sell off post Fed. I am looking at the lows printed in June of this year… and likely new yearly lows as we take those levels out. This applies to other major US market indices such as the Dow Jones, the Nasdaq and the Russell 2000.
In summary, expect more stock market downside unless certain technical levels are taken out and we see a reversal in the Dollar and bond yields. Let’s watch the June lows to see how price reacts. If we can hold above, perhaps we can begin to build a case for reversal.