
Oil is currently testing a critical support level!
But it isn’t just this commodity. With the market fearing a Fed 1% rate hike later this month, and earnings season not kicking off with a bang (JP Morgan earnings fell 28%), there is a lot happening in the markets.
Global equities are red. Really big drops in Europe with European equity markets likely to confirm fresh breakdowns by closing below recent lows. The precious metals are getting slammed along with the commodity space. Recession fears and the stronger US Dollar are to blame. The point is that many critical support levels are to be tested in coming days if this sell off intensifies. It could get real ugly real fast.
I have predicted this sell off in oil as the technicals all met my criteria for a reversal. On June 21st, I notified readers that oil had confirmed a crucial breakdown. I even highlighted the fact we would likely see a pullback before oil resumes its downtrend. This is what exactly happened.
I even updated viewers on Youtube:
As you can see by the title, a drop in oil does increase the probability that we could be a few months away from peak inflation. The non-monetary inflation that is. With oil prices rising, energy and transportation costs have been rising. This has affected everything as pretty much most goods businesses rely on transporting goods to other places. The costs have risen due to higher oil prices, which translates to prices of goods rising in order for businesses to cover the rising costs. Higher oil prices resulting in increased costs are being passed down to the consumer.
This is why oil prices dropping can be seen as a positive thing. Not to mention lower prices will help the consumer at the pumps. Gasoline is a major part of the CPI (inflation) numbers.
But if we look at oil dropping along with everything else, one should realize that recession fears are playing out. This in itself should be enough to tame non-monetary inflation as recessions tend to be demand killing events.

The price of oil is breaking down. We are well below $100 a barrel. Now the question is if we can remain below $100 for a long duration. Of course geopolitics, and perhaps OPEC+ could be triggers to get oil back above $100, but for now, economic slowdown is the catalyst. Less demand but more supply leading to prices dropping.
Our trendline and retest are there for people to see. $115 was the rejection and we confirmed our first lower high in this new downtrend.
Now oil is testing critical support at $94. At time of writing, we are set to close below this support level which would confirm a major breakdown. This would mean oil has a lot further to drop. Today’s close is going to be very important so be sure to keep tabs on it!

If I zoom out to the weekly timeframe, an astute technical analyst will see signs of certain market phases. We clearly have the uptrend, and one could say oil has been ranging between $125 and $94. A weekly close below $94 just strengthens the case for a new downtrend even more.
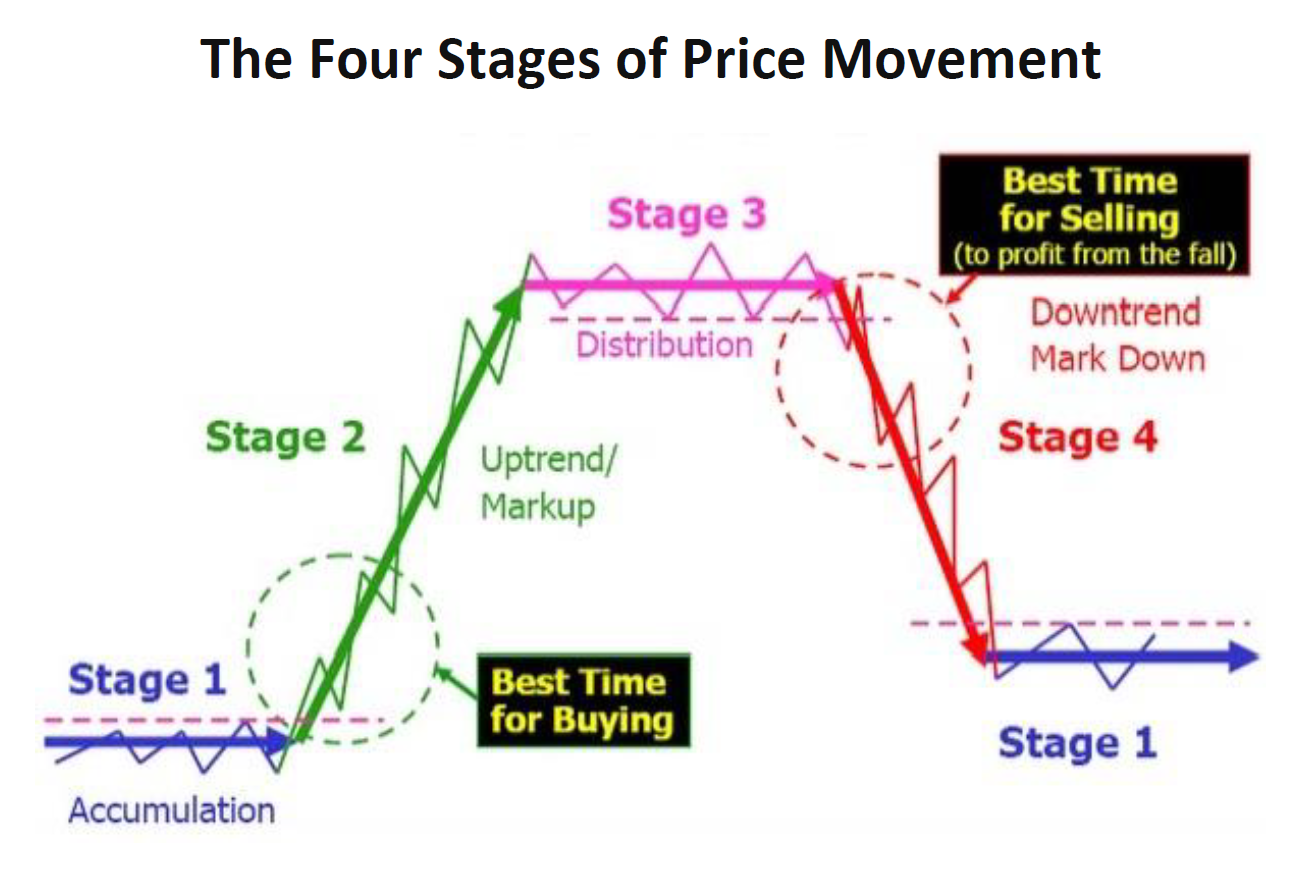
If you compare the charts of oil to Stan Weinstein’s market stage analysis, we are clearly in stage 3 going to stage 4. In technical jargon, stage 3 is the range after an uptrend showing exhaustion, and stage 4 is a new downtrend after breaking below the range.
What would be the longer term target for the price of oil if the technicals play out? On my chart, I would be targeting the $65 zone.
But let’s not get ahead of ourselves. We first need to confirm the breakdown. The price action currently looks promising, but markets tend to sometimes see a surge of buying out of nowhere to ensure critical support levels are not taken out.